Disclaimer: The information presented does not constitute financial, investment, trading, or other types of advice and is solely the writer’s opinion.
- Bitcoin Cash forms both a triangle pattern as well as a range
- To buy or not to buy, that is the question
Bitcoin [BTC] surfaced above the $20k mark for a few hours. The selling pressure it faced near $20.5k meant that bulls might be able to count those precious hours above $20k on their fingers. The $19.6k-$19.8k mark has once again become a crucial level for the bulls to defend. Bitcoin Cash [BCH] also posted some gains in recent days.
Here’s AMBCrypto’s Price Prediction for Bitcoin Cash [BCH] in 2022
A recent article pointed out that there were many short-term bearish factors at play behind Bitcoin Cash. Have the bulls been able to overcome these obstacles, or do the sellers still have the upper hand?
Range, triangle, key level- what gives?
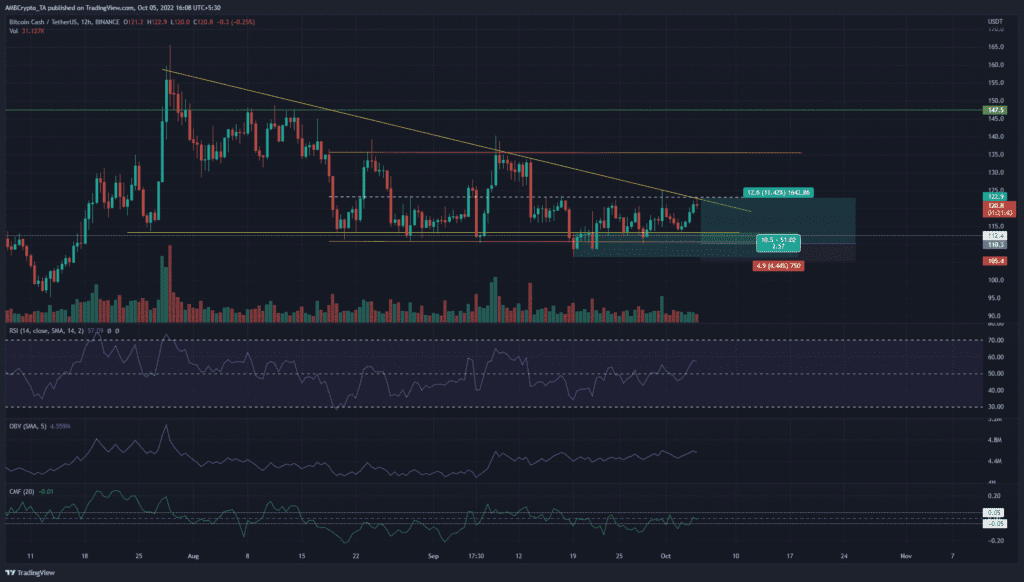
The chart had two, slightly different scenarios that could unfold over the next week. Highlighted in yellow, a descending triangle was spotted. BCH surged to $164 in mid-July but was rebuffed in that area. Since then, the price has formed a series of lower highs. A daily session close beneath $108.4 would likely signal another leg downward, while a session close above $124.8 could set bullish targets for BCH.
On the other hand, a range (orange) was also spotted and BCH traded within it in the past six weeks. The mid-point of this range was at $123.1. For nearly a month now, this was the level that has posed hefty resistance to BCH bulls.
The $112 level was also a key support level in the past four months, and a retest of this level would likely offer a buying opportunity. Yet, there was also a good chance that a bullish Bitcoin over the next few days could spur BCH above $123.
A rejection at $123 and a retest of the range lows can be used to enter a long position. The target would be $123 again, with a stop-loss at $105.4. This notion was in line with the range formation. However, a breakout past $123 could confirm a bullish breakout from the triangle pattern. In that case, bulls can look to buy a retest of the the same level. Take-profit targets would be $134, $145 and $155.
MVRV has improved since July, but is the bottom in?

Source: Santiment
According to Santiment, the Market Value to Realized Value (MVRV) ratio has been improving since July. Even though BCH has traded around the $110 area for a good portion of the time since July, the MVRV metric grew less bearish. What was more interesting is the fact that the MVRV in July reached the level it had previously visited in January 2019. But, the lows from December 2018 were still a good distance away from July 2022’s lows.
Since September, the funding rate on Binance has been negative but also began to converge toward 0%. The price has also been in a range in this time. Together, it suggested that bears no longer had the overwhelming majority in the futures markets.
A move below the $105-$110 area could invalidate the range idea as well as the bullish breakout from the triangle. Instead, it could signal another drop toward $95 or even lower for BCH.