Disclaimer: The information presented does not constitute financial, investment, trading, or other types of advice and is solely the writer’s opinion
- The higher timeframe structure was bearish, but there was a possibility of a bounce
- The $1 mark could be crucial for bulls and bears in the coming days
MATIC saw growth in the DeFi space as its Total Value Locked (TVL) outdid that of Avalanche’s. It also received praise from Vitalik Buterin regarding its newly launched zk-EVM.
Read Polygon’s [MATIC] Price Prediction 2023-2024
But this slew of positive news did nothing to stop the nasty price action on the charts. On 8 and 9 November, MATIC shed nearly 40%, only to bounce by 45% on 10 November. For higher timeframe traders, an opportunity to buy the asset can arise soon, but caution would be key.
A bounce from a gap on the charts can occur, but the sentiment can quickly sway bearish
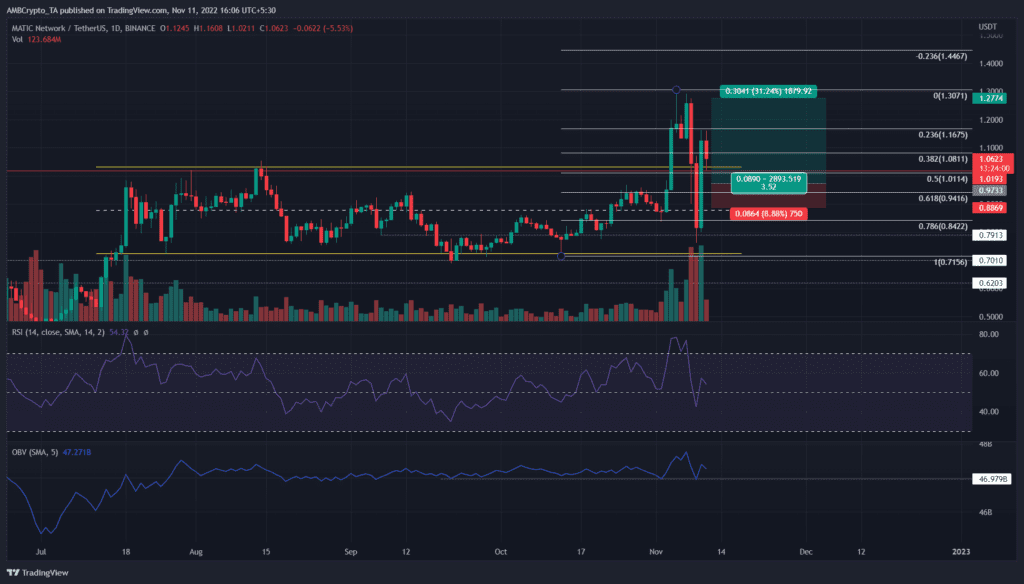
The past week saw a significant volume breakout past the range (yellow) MATIC has traded within since July. In this process, the $1 psychological mark was convincingly broken. Near the $1.3 level, substantial resistance was seen. With Bitcoin’s shift to a lower timeframe bearish bias on 7 November, MATIC began to retrace.
It dropped as low as $0.77 before recovering spectacularly to reach $1.14 on 10 November. For higher timeframe traders, this kind of volatility can be daunting. On the other hand, lower timeframe traders might have a field day trading the volatility.
The positives for MATIC were that Relative Strength Index (RSI) could climb above neutral 50 while the On-Balance Volume (OBV) defended a support level from mid-September. Yet, in the face of the price action in recent days, these factors might not count for much.
A glance at a lower timeframe chart (four-hour) showed that the rally on 10 November left a fair value gap (inefficiency) in the $0.96-$1.02 region. Hence, it was likely MATIC would drop to this area in the coming days. Traders with a larger risk appetite can assess buying opportunities in this zone on the lower timeframes.
A bounce from this zone can seek out the local highs near $1.3. Invalidation of this bullish idea would be a session close below $0.9, as $0.92-$0.96 has been a support zone in recent days.
Supply on exchanges drops while sentiment is weakly positive
![Polygon [MATIC] sees an inefficiency on the charts, should you buy it?](https://ambcrypto.com/wp-content/uploads/2022/11/PP-3-MATIC-santiment.png)
Source: Santiment
The supply on exchanges metric began to trend upward on 21 October and continued to do so till 6 November. During this time, MATIC saw a steep rally and an even quicker sell-off. Since then, this metric witnessed a dip. The inference was that selling pressure could have waned, based on the evidence this metric provided.
In a similar fashion, the weighted sentiment behind MATIC was hugely positive during the rally to $1.3 but petered out after that. It was certainly fair to say that investor confidence has taken a hit in the past few days. Active deposits of MATIC have also been high in the past week, which resulted in huge surges in short-term selling pressure.