BNB’s popularity in the crypto industry was yet again proven recently after the altcoin made it to the list of ‘Most Visited Coins’ by Cryptorank.io.
Here’s AMBCrypto’s Price Prediction for BNB for 2023-24
⚡️Most Visited Coins (7d) by @CryptoRank_io
23 October 2022#Aptos $APT #BITCOIN #BTC $BTC $SOL #TRON #TRX $TRX $XRP #XRP #Cardano $ADA #BNB $BNB $CHZ $AVAX #Litecoin #LTC $LTC pic.twitter.com/24imQw6WEs— 🇺🇦 CryptoDep #StandWithUkraine 🇺🇦 (@Crypto_Dep) October 23, 2022
Not only this, but several developments also happened in the BNB ecosystem that added much value to the network.
For example, the partnership of BNBChain with SCDEVSTR. It would help BNB work closely with an instrumental community in the region as they continue to build Web3 together.
Excited to announce #BNBChain will be partnering with @scdevstr 🚀
The partnership with Smart Contract Developers Turkey will see us work closely with an instrumental community in the region as we continue to build #Web3 together. pic.twitter.com/gsYpfWx3OT
— BNB Chain (@BNBCHAIN) October 24, 2022
However, these developments did not help BNB climb up the price ladder, as its chart was mostly painted red.
According to CoinMarketCap’s data, at press time, BNB’s value was down by 1.25% during the last week and was trading at $274.02 with a market capitalization of $43.83 billion.
Which way will BNB go?
BNB’s on-chain metrics painted an ambiguous picture, as some of them suggested a price increase while others favored the sellers.
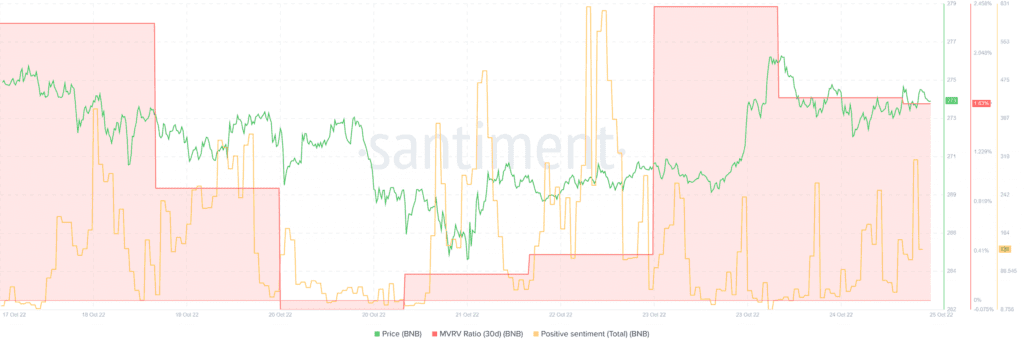
For instance, BNB’s MVRV Ratio went up but then registered a downtick on 24 October. It can be taken as a bearish signal that hints at an anticipated price decline. Not only this, but BNB’s positive sentiment metric, after increasing last week, registered a fall.
However, BNB’s daily active addresses were steady during the last week. Thus, suggesting that a constant number of users were active in the network, which is a positive signal.
Investors should be cautious
Despite several on-chain metrics supporting BNB, a look at BNB’s daily chart revealed that investors should be careful. The Exponential Moving Average (EMA) Ribbon indicated a bearish advantage in the market as the 55-day EMA was resting above the 20-day EMA.
The Relative Strength Index (RSI) was also idle near the neutral position. Moreover, BNB’s Chaikin Money Flow (CMF) registered a downtick and was headed toward the neutral mark. This was yet another bearish sign.
Interestingly, the Bollinger Bands revealed that BNB’s price was about to enter a squeezed zone, further decreasing the chances of an uptick in the coming days.


