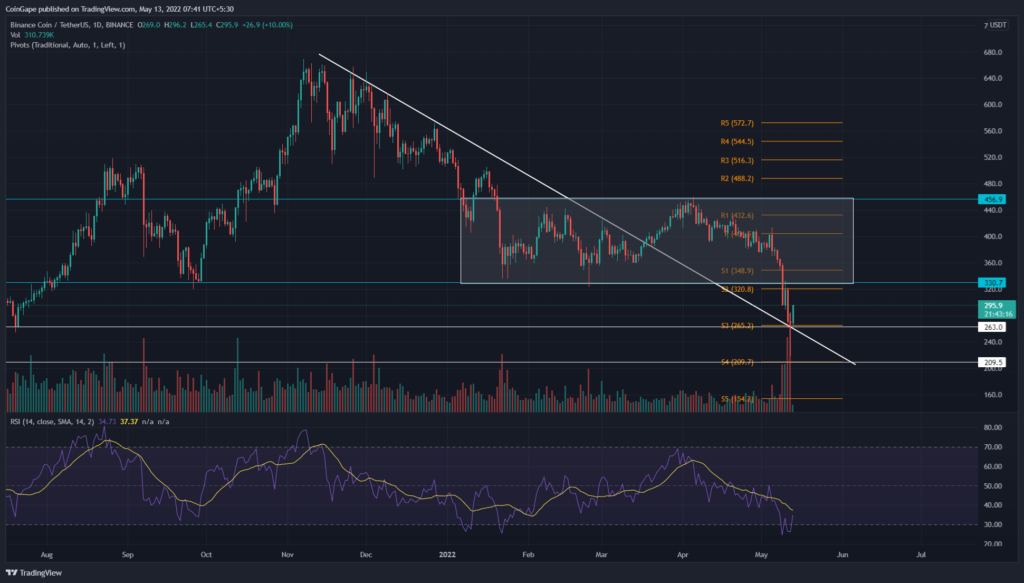
On May 9th, the Binance(BNB) price escaped from a four-month consolidation phase through the support fallout of $335. The released selling momentum plummeted the altcoin 21.8% lower to $261. However, today, the crypto market is bullish on the intraday level and reverted the coin price with a morning star candle pattern.
Key points
- The BNB price bounced back from $263 support with a morning star candle.
- The Daily-RSI chart shows a positive divergence concerning the price action.
- The intraday trading volume in the BNB price is $29.6 Billion, indicating a 29% loss.
Source- Tradingview
The March recovery rally in the crypto market triggered a bullish breakout from the descending triangle pattern.
The resulting rally drove the Binance(BNB) price to the $456 mark; however, the buyers couldn’t push the price further, resulting in an immediate reversal. Responding to the broader market sentiment in April, the sellers continued to pressurize the altcoin and plunged it below $335.
The post-retest fall tumbled the BNB price by 21.1% and slumped it to may-July 2021 bottom support of $263. However, yesterday the seller’s failed attempt to breach this support resulted in a long-tail rejection candle, indicating the demand pressure below.
Trending Stories
Today, the buyers followed with a long bullish candle of 11.5% intraday, bringing the BNB price to the $300 mark. If buyers continue to push prices higher, the altcoin will challenge the flipped $335 resistance with breakout motives.
Succeeding through his plan, the BNB price could climb back to the $456 mark.
Technical indicator
The traditional pivot levels aligned with some important chart levels offer additional confirmation of those areas of interest. The indicator shows a confluence of S3 with $265, providing strong support, whereas S2 and $322 show significant resistance.
Following a bullish divergence, the daily-RSI slope pumped higher bolster recovery theory for BNB.
- Resistance level- $335 and $456
- Support levels- $261 and $210


