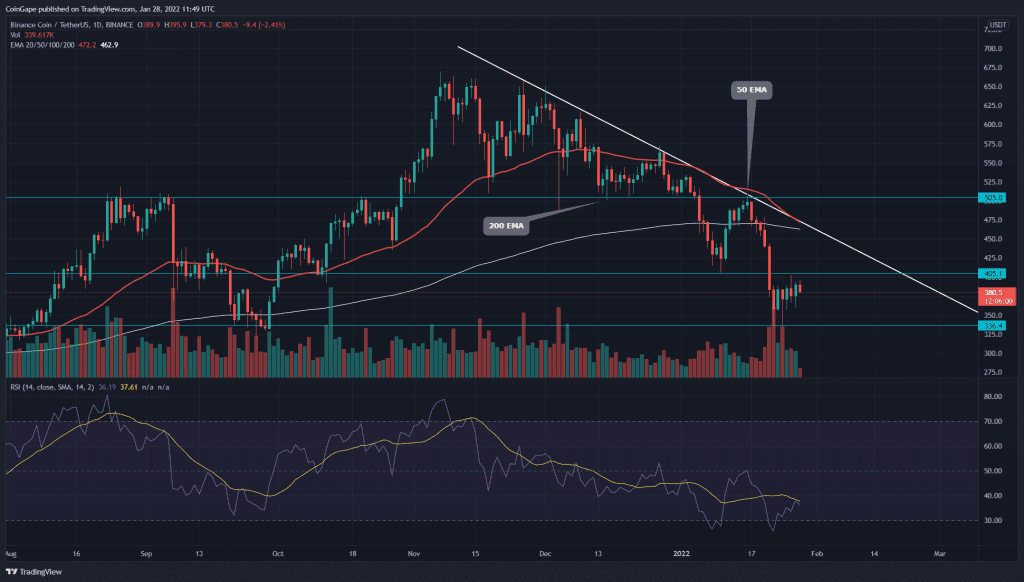
The Short term downtrend in BNB has tumbled to coin price by 50% and dropped to the $333 support. The buyers are trying to hold the price above the $336 mark, indicating this support as a high area of interest for possible reversal. Moreover, Binance has recently announced its partnership with Gulf Energy Development to establish a new digital asset trading platform in Thailand.
Key technical element to ponder
- The BNB coin chart tease a death crossover among the 50-and-200-day EMA
- The intraday trading volume in the BNB Network coin is $1.81 Million, indicating a 20% loss.
Source- Tradingview
In our previous coverage of the Binance coin, Coingape warned the correction phase would extend as the coin price was rejected from the descending trendline ($505). However, the sudden sell-off in the crypto market bolstered the ongoing selling pressure and slipped the price to $336.
The coin buyers have managed to halt the downfall at the $336 mark. The technical chart shows several lower price rejection candles at this AOI, indicating high demand pressure at this support
The Relative Strength Index(36) presents a bullish divergence for the $405 and $336 lower low. The RSI slope rising in the accumulation phase indicates the increasing strength of bulls.
The 50-day EMA line along with providing dynamic support to BNB price threatens a death crossover with 200 EMA.
Bullish Opportunity Above The $405 Mark

Source- Tradingview
The BNB/USD pair has been consolidating between the $405 and $336 mark for the past week. This narrow range calls for excellent trading opportunities when the pair breaks free from either of its levels. Therefore, the buyers can expect a bullish recovery above the $405 mark.
On a contrary note, if the coin price fails to surpass the descending triangle or violate the bottom support($336), this pair may sink to the $260 mark.
- Resistance level- $405 and $505
- Support levels- $336 and $260


