Similar to more than 90% of NFTs, BAYC saw a significant reduction in sales volume due to negative market sentiment during the seventh month of the year.
Bored Ape Yacht Club has climbed above CryptoPunks to become the second-largest NFT by all-time sales volume with more than $2.3 billion, as of August 10.
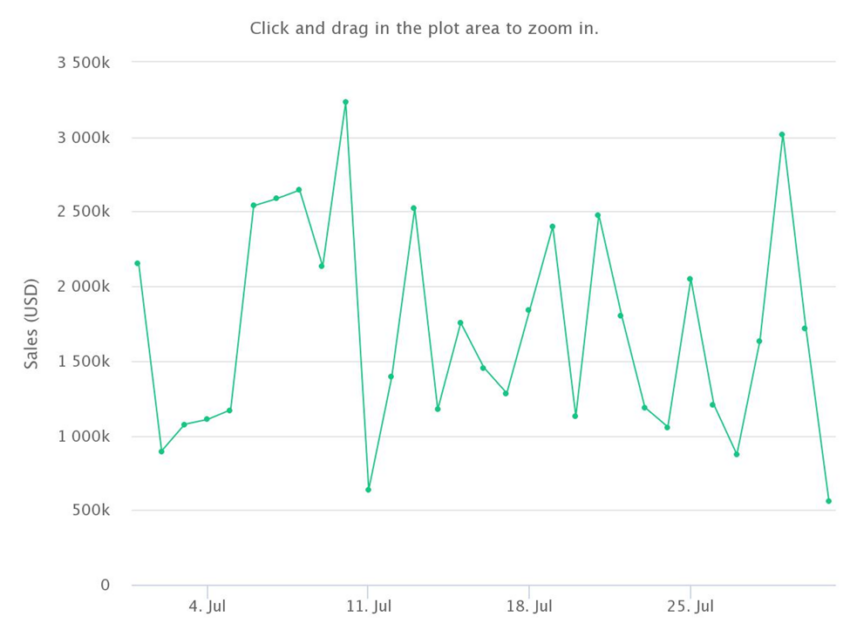
Bored Apes had a total sales volume of around $52.7 million, according to Be[In]Crypto Research per data from CryptoSlam.
While this metric may seem small due to the popularity of the BAYC project, it dwarfed sales from Otherdeeds, Mutant Ape Yacht Club (MAYC), Bored Ape Kennel Club (BAKC), CryptoPunks, Axie Infinity, and NBA Top Shots among others.
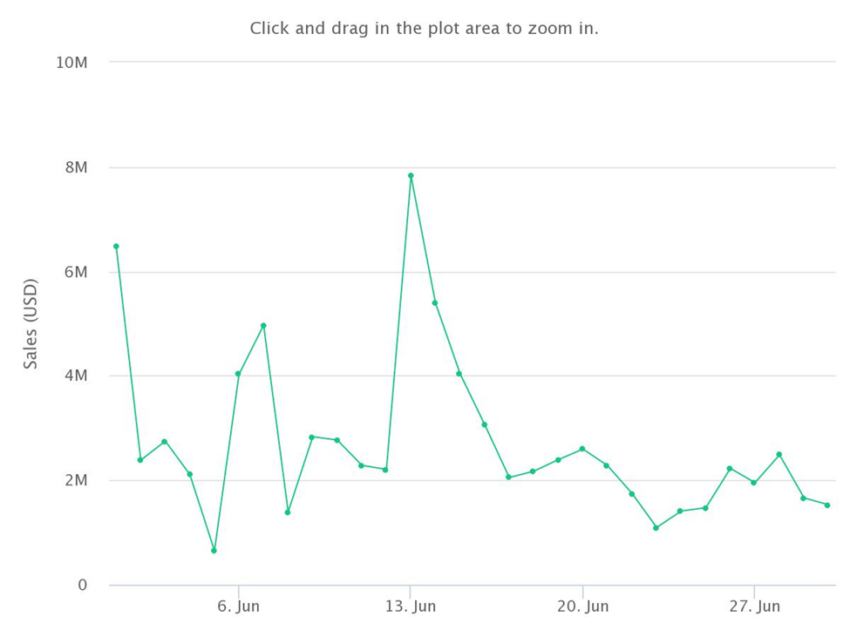
However, July’s sales were a 36% dip from June’s volume of $82 million.

Why the fall in BAYC sales?
When you scrutinize the dip in the number of unique buyers from July, the fall in sales caused the drop in transaction counts, with 290 unique buyers, and 515 transactions.
In comparison to June, there was a 31% decrease in unique buyers (424) and transactions (748).
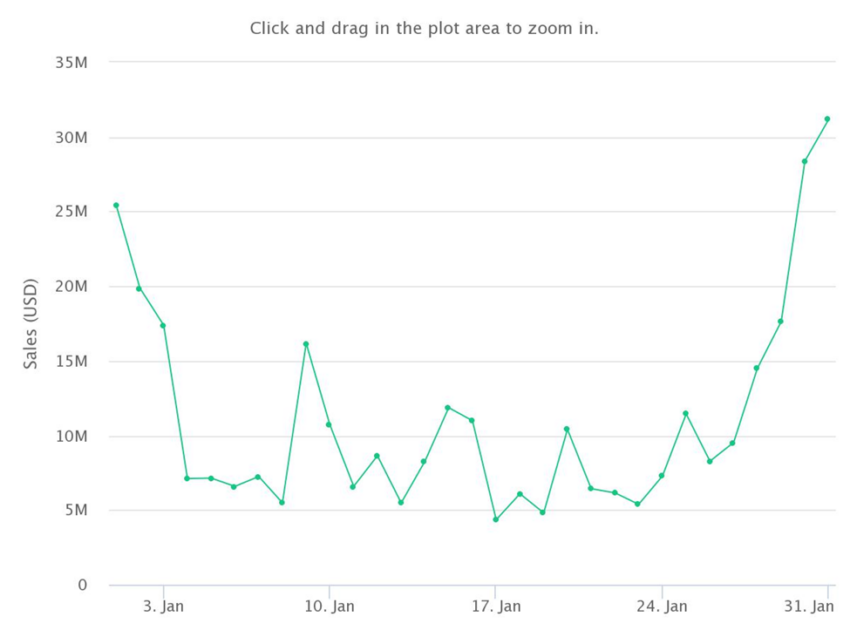
In contrast to the metrics in January when Bored apes reached a peak in sales, unique buyers stood at 937 which corresponded to 1,456 transactions. In Jan, sales volume was about $346 million.

After generating less than $60 million, Bored Apes reached a yearly low where it shed $294 million of Jan’s sales.
Aside from unique buyers and transaction counts, average sale value also plummeted. There was a 57% decline in average sale value from $238,139 in January to $102.334 in July.
APE price reaction
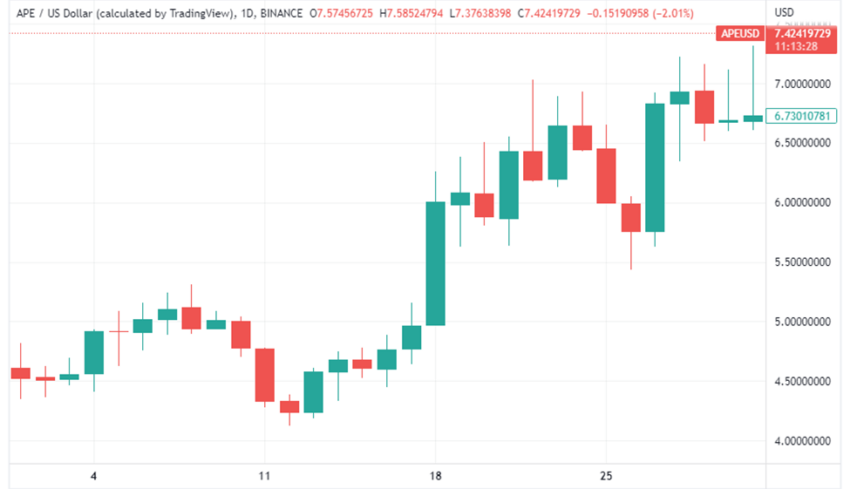
APE opened on July 1, with a trading price of $4.63, reached a monthly high of $7.26, tested a monthly low of $4.20, and closed at $6.72.
Overall, despite a plunge in sales volume, there was a 45% increase between the opening and closing price of APE in July.

What do you think about this subject? Write to us and tell us!
Disclaimer
All the information contained on our website is published in good faith and for general information purposes only. Any action the reader takes upon the information found on our website is strictly at their own risk.


