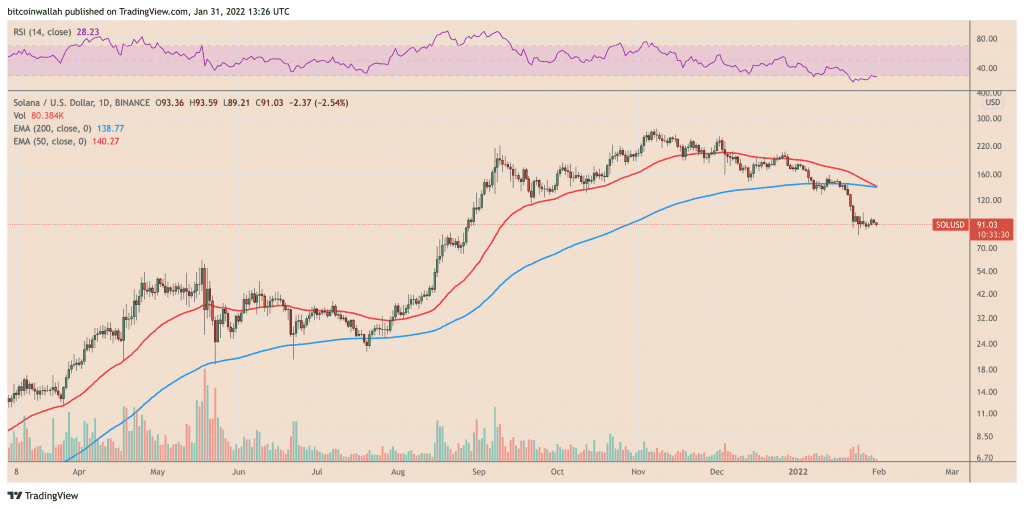
Solana (SOL) looks poised to paint its first “death cross” this week, raising fears that its ongoing selloff would continue further into February.
Real selloff threat
Notably, the SOL price’s 50-day exponential moving average (50-day EMA; the red wave) will eventually close below its 200-day EMA (the blue wave), signaling a bearish crossover, called a death cross, that typically prompts traders to sell.
The threat surfaces as SOL looks to close January at nearly a 50% loss — as of the month’s final day, the Solana token was down by over 2.50% to nearly $91, compared to almost $180 at the start. Meanwhile, the catalysts behind SOL’s price crash remain pretty much intact.
Crypto-assets have fallen this month as traders have attempted to assess how fast the Federal Reserve would increase its benchmark rates from near-zero levels to tame booming inflation and tighter jobs market. Solana, as a result, has wiped half its market valuation in January from $55.19 billion to $28.79 billion; that is, after it closed 2021 at a whopping 11,144% profit.
That has got some financial experts to expect a “crypto winter” ahead, a term referring to concerning bearish cycles in the cryptocurrency market, such as the one seen during 2018 wherein digital assets’ combined market cap fell by more than 80%.
It’s during crypto winters that the best entrepreneurs build the better companies. This is the time again to focus on solving real problems vs. pumping tokens.
— David Marcus – dmarcus.eth (@davidmarcus) January 24, 2022
As of now, SOL’s interim bullish outlook hangs over its possibility to hold above $83, its current support level. A break below the said price floor could have the Solana token find its next pullback opportunity not until $65, as shown in the chart below.

Both support levels were instrumental in sending the SOL/USD pair to its record high above $260 last year.
Philip Gunwhy, partner at Blockasset.co, remained long-term bullish on Solana, citing its exponential growth in the decentralized finance (DeFi) and nonfungible token (NFT) sectors that, in turn, tends to boost SOL’s demand. However, the analyst noted that SOL’s swift rebound in the short term depends on the performance of the broader crypto ecosystem.
“For Solana, maintaining solid support at $65–$85 area is undoubtedly the primary focus for the week while maintaining a longer-term focus to retest its All-Time High around $260,” Gunwhy said.
Rebound scenario
No previous data shows how SOL traders react to a death cross since it will be Solana’s first 50–200-day EMA bearish crossover to date. But considering that people who trade SOL have been trading Bitcoin (BTC) over the recent years, one can notice that death crosses bother them very little.
For instance, a 50–200-day EMA crossover, witnessed in the Bitcoin market in June 2021, followed a drop towards $29,000. But a month later, the BTC price bounced back strongly, eventually reaching its all-time high of $69,000 in early Nov. 2021.

Similarly, over the past decade, death crosses in the S&P 500 (SPX) have lost their significance due to false bearish alarms. For instance, the last two bearish crossovers between the SPX’s 50-day EMA and 200-day EMA — in December 2018 and March 2020 — led to bottom formations, followed by strong price rebounds.

That raises the possibility that SOL’s death cross would have its price bottom out in the coming sessions, followed by a bullish reversal. In doing so, the Solana token may eye previous support/resistance levels for a potential rebound move towards its 200-day EMA.

More cues for a bullish rebound also come from the SOL price’s oversold relative strength index (RSI), a classic buy signal.
The views and opinions expressed here are solely those of the author and do not necessarily reflect the views of Cointelegraph.com. Every investment and trading move involves risk, you should conduct your own research when making a decision.


