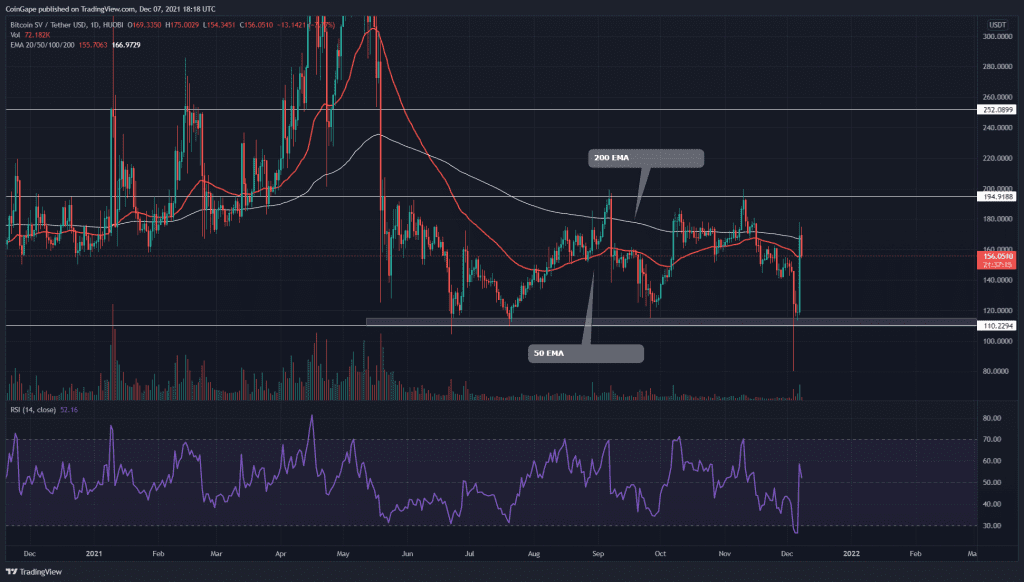
On December 6th, the long-awaited result of the identity of Satoshi Nakamoto has dropped in favor of Craig Wright. The BSV coin, following the primary vision of Satoshi Nakamoto(Craig Wright), showed a sudden price surge of 42% in its intraday session due to this news. Furthermore, the technical chart shows the coin is still in a range-bound movement, maybe preparing for even a bigger move than this.
Key technical points:
- The BSV price reclaims the 50-day EMA
- The intraday trading volume in the BSV coin is $1.03 Billion, indicating an 87%. again
Source- BSV/USD chart by Tradingview
Since the bloodbath of may, the BSV coin had never seen what’s beyond the $200 mark. For almost six months, that price has been wobbling between two definite levels of $290 and $110, creating a definite range for the coin. This range represents a resting period for the coin, which will eventually provide a strong directional move when the price breaks out from the border levels of this range.
The crucial EMA levels(20, 50, 100, and 200) indicate a bearish for this coin since its price is trading below the trend defining 100 AND 200 EMA. However, the Relative Strength Index(52) moving above the neutral zone maintains a bullish sentiment within the BSV coin.
BSV/USD 4-hour Time Frame Chart

Source- BSV/USD chart by Tradingview
The BSV coin shows some minor resistance/support levels in this lower time frame chart. After bouncing from the bottom support on December 6th, the coin price knocked out the nearest resistance level of $110, trying to move to the other side of the range.
The coin price is currently struggling to sustain above the next resistance level of $162. in case of a fallout, the $110 should act as a good support level and help the price sustain the bullish sentiment.


