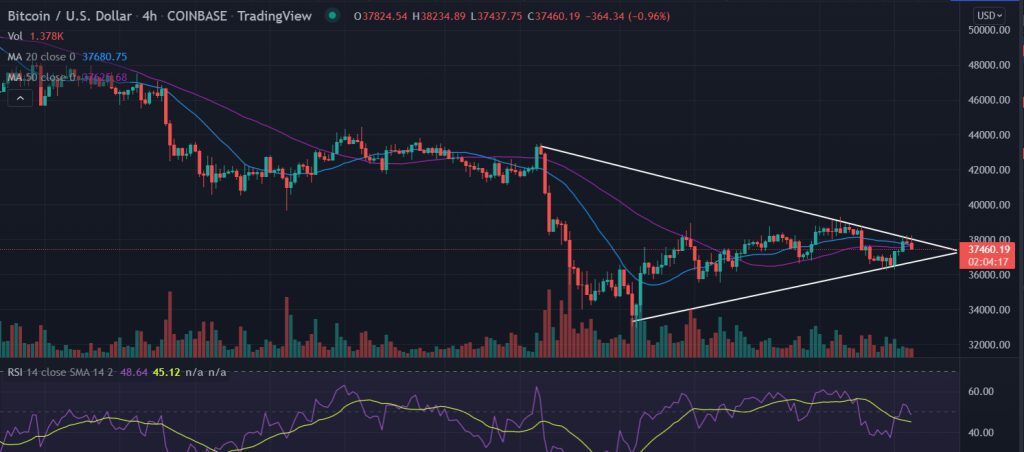
Bitcoin’s (BTC) price has been trading higher in a consolidated range. BTC price is trading in a very tight range as indicated by low trading volume and muted price action over the past few days. At press time the bitcoin is changing hands at $37,654, down 0.42% for the day.
- Bitcoin (BTC) price trades with modest gains on Friday.
- The price is at a cross-road between buyers and sellers.
- Expect wide swing movement once the symmetrical triangle gives breakout.
Read More: Kazakhstan Extends Power Cuts for Cryptocurrency Miners For Another Week
Symmetrical Triangle Breakout will decide the next level for BTC Price
On the daily chart, the Bitcoin (BTC) price has been on a constant decline since November. Currently, the price hovers near the 20 and 50 DMA at the intersection of $37,500. A break above or below $38 could be a changing point for the BTC price action.
The symmetrical triangle formation suggests BTC price could give a break out in either direction. However, the bears are pushing the Daily Relative Strength Index (RSI) below 50 exerting pressure on the bitcoin.
At the time of writing, the price has broken below the 20 and 50 moving average crossovers. Sellers would now be applying all the forces to meet the lower trend line of the symmetrical triangle at $36,156.
Next, the market participants could meet the next hurdle at $34k.
Let’s discuss another possibility from here, if the price is able to breach the $38k with good volumes then investors would jump toward the psychological $40k level in the next attempt.
In conclusion, the price will follow the breakout in the symmetrical triangle either upside or downside. Further, as per the above-given arguments, the possibilities are more for the $36k followed by the lows of January 24 at $32,923.


