Published 31 mins ago
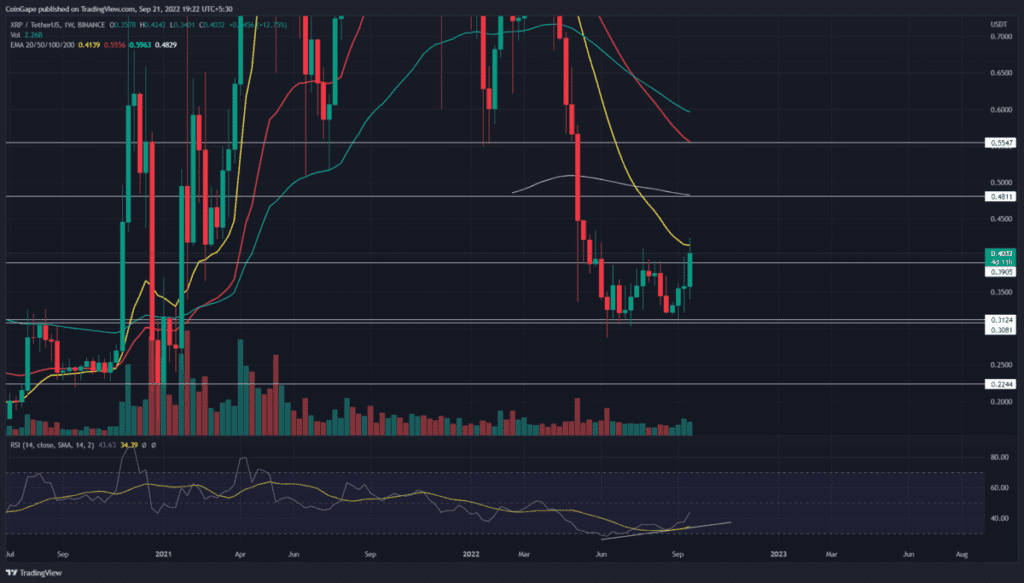
Over the past three months, the weekly technical chart shows two swing lows bounced back from the $0.315 support. In addition, the W-shaped formation in the chart reveals the shape of a double bottom pattern. This bullish reversal pattern is pretty standard at the market bottom, bolstering a significant recovery after proper execution. Will XRP price hit $0.48 mark?
advertisement
Key points:
- A bullish-RSI divergence shows a higher possibility for price recovery.
- The 20 EMA resistance in the weekly chart could encourage the failure of a bullish pattern.
- The intraday trading volume in the XRP is $3.9 Billion, indicating a 41% gain.

Source- Tradingview
The two bullish reversals from the $0.135 support indicate the traders are actively buying at the level. As a result, the XRP price rallied 33% over the fortnight and marked a high of $0.421.
On September 20th, this bull run gave a massive breakout from the $0.39 neckline resistance. Thus, surpassing a resistance level after the support reversal provides additional confirmation for a future rally.
Trending Stories
Earlier today, the XRP price chart showed a 5% intraday loss and retested the $0.39 level as potential support. However, by the pressure, the buyers have recovered some losses and displayed a lower price rejection candle.
This low-wick rejection candle shows sustainability above the $0.39 support, providing an entry opportunity to interested buyers. With sustained buying, the XRP price could rally 20% higher to $0.48 resistance.
On a contrary note, if the buyers cannot sustain above the $0.39 level, closing below will extend a sideways rally above $0.315.
Technical Indicator
EMAs: Along with neckline breakout, the XRP price reclaimed the 100-day EMA slope. Moreover, the coin chart reflects a buy signal with the bullish crossover between the 20-and-50-day EMA.
advertisement
Relative Strength Index: The daily RSI slope shows a significant bullish divergence for the two swing lows within the price pattern. This divergence supports the completion of the bullish pattern and recovery theory.
XRP price intraday level
- Spot rate: $0.40
- Trend: Bearish
- Volatility: Medium
- Resistance levels: $0.425 and $0.45
- Support levels: $0.39 and $0.31
Share this article on:
The presented content may include the personal opinion of the author and is subject to market condition. Do your market research before investing in cryptocurrencies. The author or the publication does not hold any responsibility for your personal financial loss.


