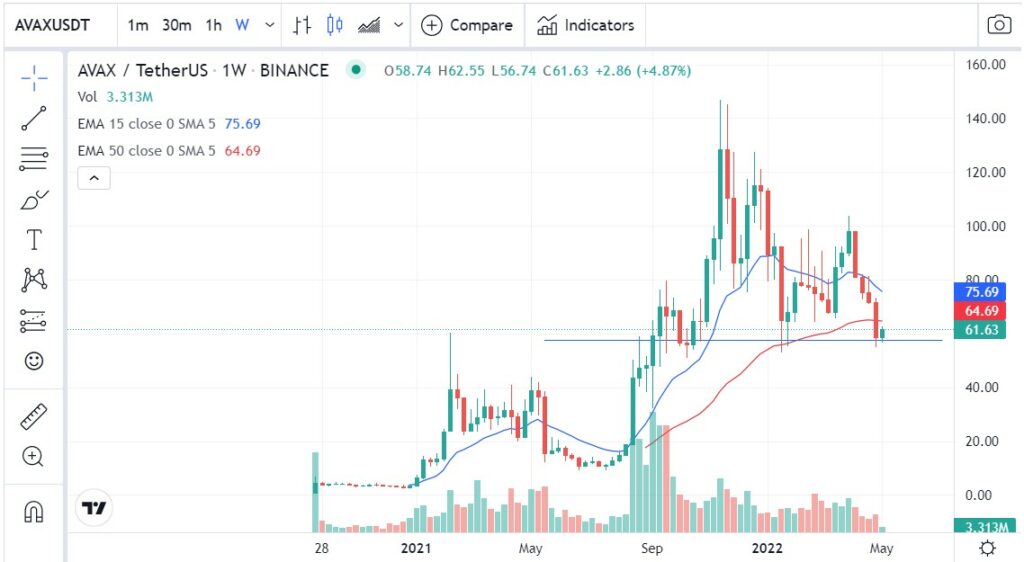
- Avalanche (AVAX) is up in the last 24 hours, taking its price to $61.43.
- AVAX is ranked number 13 on CoinMarketCap’s list of the biggest crypto projects by Market Cap.
- EMAs on the weekly chart still signal a bullish cycle for AVAX, but the cycle may end in the coming days.
Avalanche (AVAX) is up in the last 24 hours, taking its price to $61.43 at the time of writing, according to CoinMarketCap.
The price of AVAX is up 2.75% in the last 24 hours while a large portion of the rest of the crypto market has witnessed a price dip in the same time period. Despite being up in the last 24 hours, AVAX’s price is still down 15.36% in the last 7 days.
AVAX was traded more actively in the last 24 hours compared to the day prior, as the 24 hour trading volume has increased 33.96% to $905,897,399, worth around 14,732,791 AVAX at current prices.
When it comes to market cap, AVAX is ranked number 13 on CoinMarketCap’s list of the biggest crypto projects by market cap. The market cap of AVAX currently sits at $16,531,798,031.
The weekly chart for AVAX/USDT is still bullish when just looking at the 15 EMA and 50 EMA, with the former positioned above the latter. However, the gradient of the 15 EMA on the weekly chart does suggest that the two EMAs may cross soon, entering into a bearish cycle.
Nonetheless, pulls seem to be keeping the price of AVAX above $57 as this is the second time the price has tested this level this year. The previous occurrence was at the beginning of this year, and was followed by a bullish pump. The most recent occurrence of the price testing this level was last week.
It seems that the most recent test of the level may also be followed by a small bullish move, as things stand.


