Following a weekend price sabotage, Bitcoin (BTC) and Ethereum (ETH) started the week trading higher on Monday giving crypto investors some relief.
The top cryptocurrency, Bitcoin, sank below key psychological support levels before reversing course and rebounding on Monday. At the time of press, BTC and ETH were both up 6.7% in the past day.
With the top crypto assets gaining momentum, the global cryptocurrency market cap rose by over 5% to recover above the $973 billion mark.
BTC recovering, time to ‘buy the dip’?
The Bitcoin (BTC) price rose by over 6% on substantial volume, reversing the 2.8% loss it suffered over the weekend. Its weekly opening price gains triggered social buzz on crypto Twitter as traders watched it reclaim the $20,000 level.
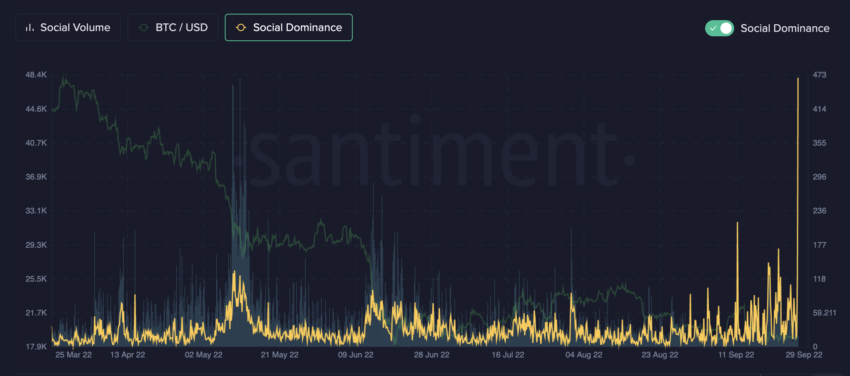
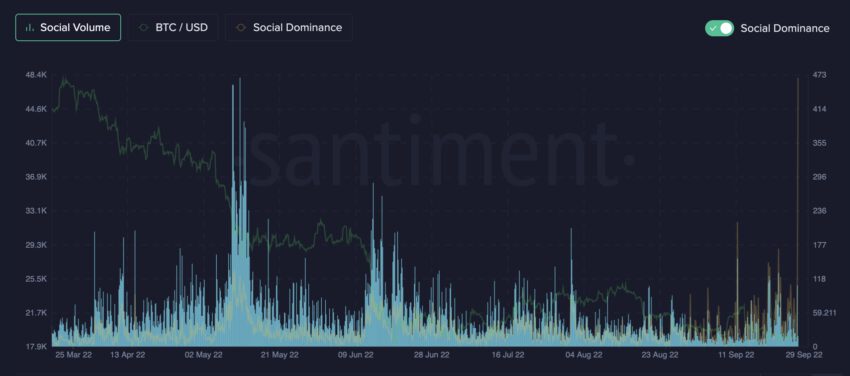
Data from Santiment showed that while the number of ‘Buy the dip’ mentions was declining, they still dominated the social media narrative.
Notably, BTC/USD social volumes declined while social dominance saw a major uptick.

Usually, ‘buy the dip’ calls happen quite often at the beginning of a downtrend and slowly fade into market bottoms. This could be explained by increasing crowd disbelief, followed by less confidence and less patience.
It is for this reason that a fading dominance of the ‘buy the dip’ calls is actually a more true way to find and predict actual market bottoms.
Long-term BTC HODLers keeping price afloat
Despite a shaky macroeconomic outlook, the number of BTC owned by long-term holders (LTHs) continues to grow in both quantity and percentage by supply.
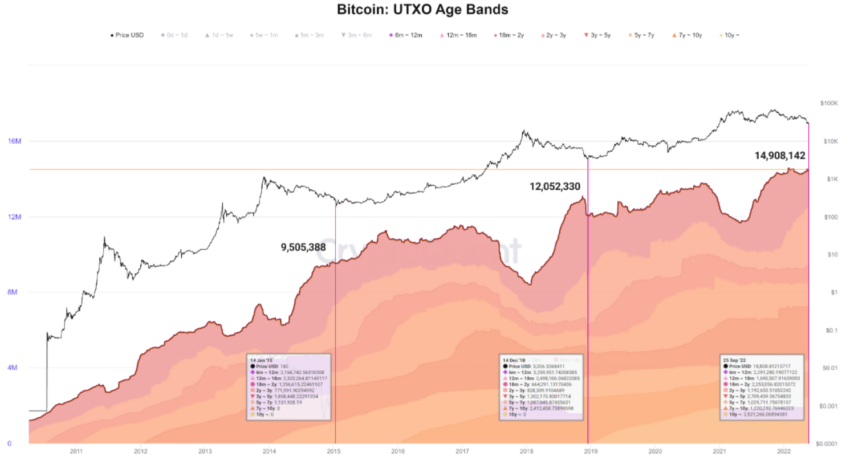
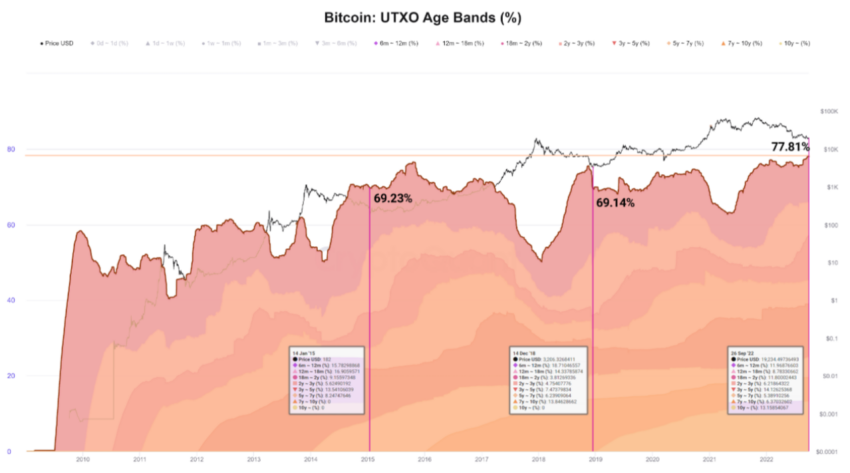
CryptoQuant data shows that the current total supply is 19,161,796 and the number of bitcoins held by LTHs (UTXOs>155 days) is currently nearing an all-time high. Furthermore, the percentage of the supply held by these users has already reached a new high.

Interestingly, the long-term holding growth remarkably increased compared to the two previous bear seasons:
- 2015 bottom: 9,505,388 — 69.23% of the supply at that time.
- 2019 bottom: 12,052,330 — 69.14% of the supply at that time.
- 2022 cycle:14,908,142 — 77.81% of the current supply.

Thus, with long-term HODLer supply showing continued growth, the same points towards higher market confidence in this metric
Disclaimer
All the information contained on our website is published in good faith and for general information purposes only. Any action the reader takes upon the information found on our website is strictly at their own risk.


