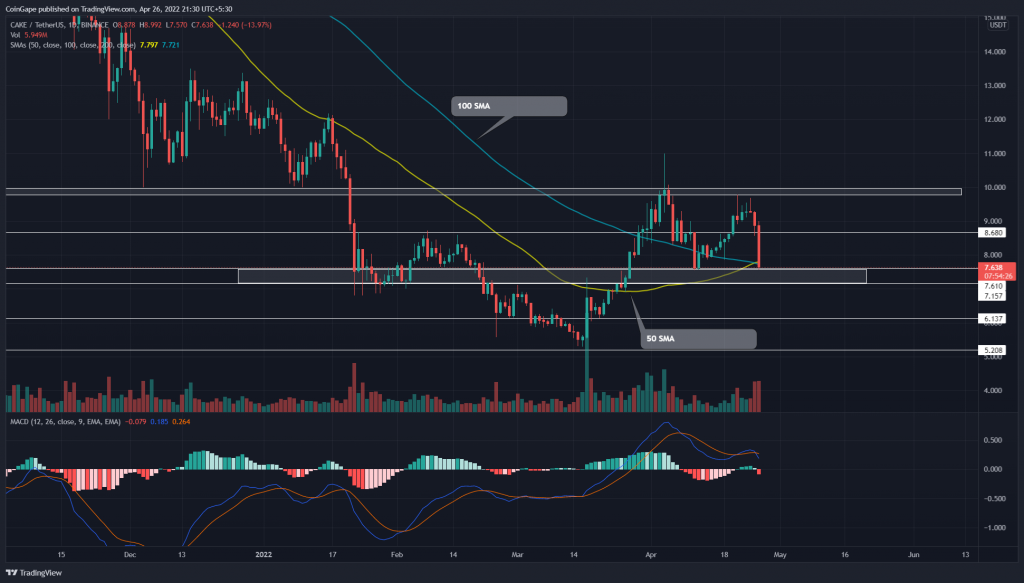
Last weekend the higher price rejection candle at $10 resistance indicated the traders are aggressively selling on a higher level. Thus, the resulting reversal dumped the Pancake(CAKE) price back to $7.6 support with the formation of a double top pattern. A possible reversal will trigger another 14.4% fall.
Key points:
- The CAKE reflects a 12% loss in the past 24hr
- A 50-and-100-day SMA performs a bullish crossover
- The intraday trading volume in the CAKE token is $172.8 Million, indicating a 3.82% loss.
Source- Tradingview
Over the past two months, the Pancake(Cake) price reverted from the $10 resistance twice, reflecting a double top pattern in the daily time frame chart.
On April 12th, the bullish reversal from the $7.6 support mounted a new higher low, suggesting the traders’ sentiment flipped from selling the rallies to buying on dips. However, the reversal rally couldn’t surpass the previous swing high resistance of $10, undermining the uptrend possibility.
Furthermore, the CAKE price turned down from the $10 resistance and fell 21% within three days. As a result, the sellers pulled the altcoin to the $7.6-$7.15 support zone, which is the neckline mark of a double bottom pattern.
Trending Stories
A daily-candlestick closing below the $7.15 mark would accelerate the selling pressure and dump the CAKE price 14.4% lower to $6.1 support.
advertisement
Technical indicator
SMA: A bullish crossover among the 50-and-100-day SMA at the $7.6 mark provides additional support for a price reversal. However, if the sellers undermine this set-up and plunge below the $7.16 support, the traders can expect a freefall to the $6.1 mark.
MACD indicator: The fast and slow line offers a sell signal with a negative crossover in the bullish region. Moreover, these lines approaching the neutral zone suggest weakness in the bullish momentum.
- Resistance levels- $.86, $10
- Support levels- $7.6-7.1 and $6.1


