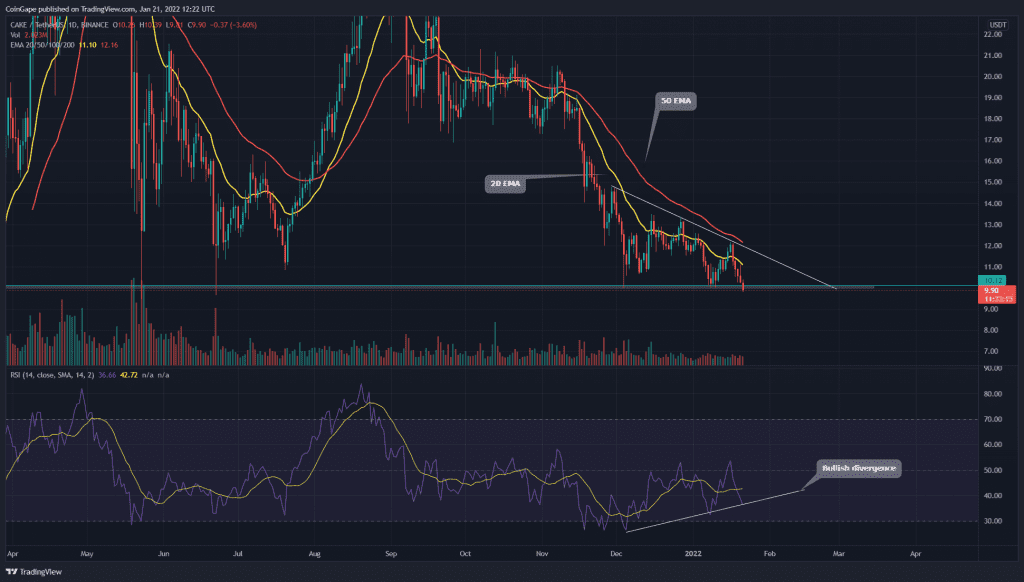
The recent retracement has dropped the CAKE token price to the Monthly support of $10. The technical chart shows a descending triangle pattern that threatens to breach this bottom support. Read the complete article to know if the token is doomed or there’s still hope for bulls.
Key technical points
- The daily-RSI chart shows a bullish divergence
- The intraday trading volume in the CAKE token is $215 Million, indicating an 83% hike.
Source-Tradingview
Last time we covered an article on CAKE token price analysis, coingape warned that the CAKE/USD price could drop to $10 support. Despite a sequence of lower highs on the upside, the bulls have managed to sustain the price above this support, resulting in a descending training pattern in the daily chart.
On January 17th, the token price was rejected from the falling trendline and plugged to the bottom support, indicating a 17% loss in just 5 days. The price currently teases a bearish breakdown from this pattern’s neckline.
The MATIC token price indicates a bearish sequence among the crucial EMAs(20, 50, 100, and 200). The 20 and 50 EMA provide dynamic resistance in this short-term downtrend.
However, the Relative Strength Index(35) slopes show a bullish divergence in its chart, indicating a decent possibility of a bullish breakout from the triangle pattern.
Can CAKE Bulls reclaim the $10 mark?

Source- Tradingview
The CAKE token price currently trading at the 9.49 mark indicates a 5.94% intraday loss. The crypto trader should wait for the daily candle closing below this $10 support to confirm a fallout and provide a short opportunity for traders.
On a contrary note, If the token manages to reject the lower price and sustain above the neckline, the triangle pattern will remain intact.
The traditional pivot level suggests the overhead supply region for CAKE token price is $10.6 and $11.4. On the flip side, strong demand can be expected at $9.25, followed by $8.45.


