Bitcoin fell below the $45.8k mark, and it could decline further south. Shiba Inu reflected overall market sentiment as it, too, saw intense selling in the past few days. However, Shiba Inu reached an area where buyers could potentially be interested.
Would the next few weeks see Shiba Inu consolidate, or will the previous downtrend continue once more? Note that SHIB prices are multiplied by 1000 to avoid excessive decimal places in writing.
Source: SHIB/USDT on TradingView
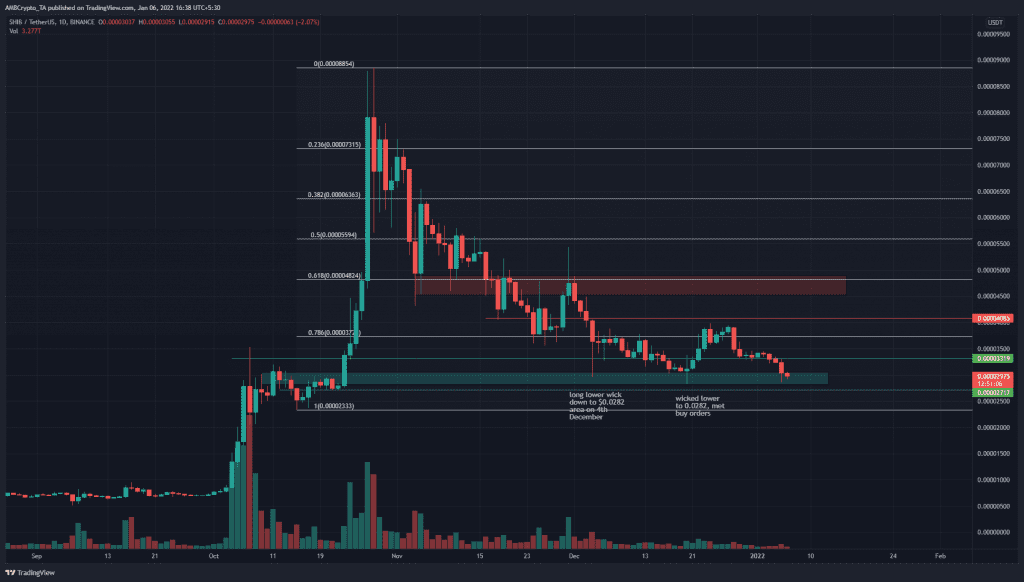
The cyan box represents an area of demand, and the price has already wicked into this area on two occasions previously. In October, this $0.027 area had acted as a supply zone for SHIB, before eventually sellers were exhausted and buyers were able to drive the prices a further 200%.
The Fibonacci retracement levels, based on this breakout, showed the 78.6% retracement level at $0.037, but SHIB was not able to hold on to this level in December. The 61.8% to 78.6% retracement area would be where buyers step in, but the past few weeks did not see sufficient demand to halt a decline.
Even if SHIB saw a bounce, a close above the most recent high at $0.039 is necessary to break the bearish structure.
Rationale

Source: SHIB/USDT on TradingView
The indicators did not show presence of bulls in the market yet. The A/D line was declining, alongside the price, which confirmed the downtrend. As for momentum, the Awesome Oscillator was moving beneath the zero line to show bearish momentum.
The Bollinger bands width indicator was near where it was in late September when the price was consolidating in the $0.0077 area. This showed that there was the possibility that SHIB was in accumulation once more at an area of strong historic demand.
Conclusion
Shiba Inu was bearish on the charts. A risk-averse investor would need to see SHIB climb back above $0.037 and flip it to support before another move to the upside. A more risk-seeking investor would seek to scoop up some SHIB at current prices but the trade needs to be carefully managed as a daily close beneath the demand area could see SHIB drop further.


