Published 10 mins ago
With a comparably bullish week in the crypto market, the altcoins are performing well to restart the uptrend. Coming out of the shadows, Litecoin price jumped 10.32% last week, resulting in a pattern breakout entry opportunity for short to midterm traders.
advertisement
Key points:
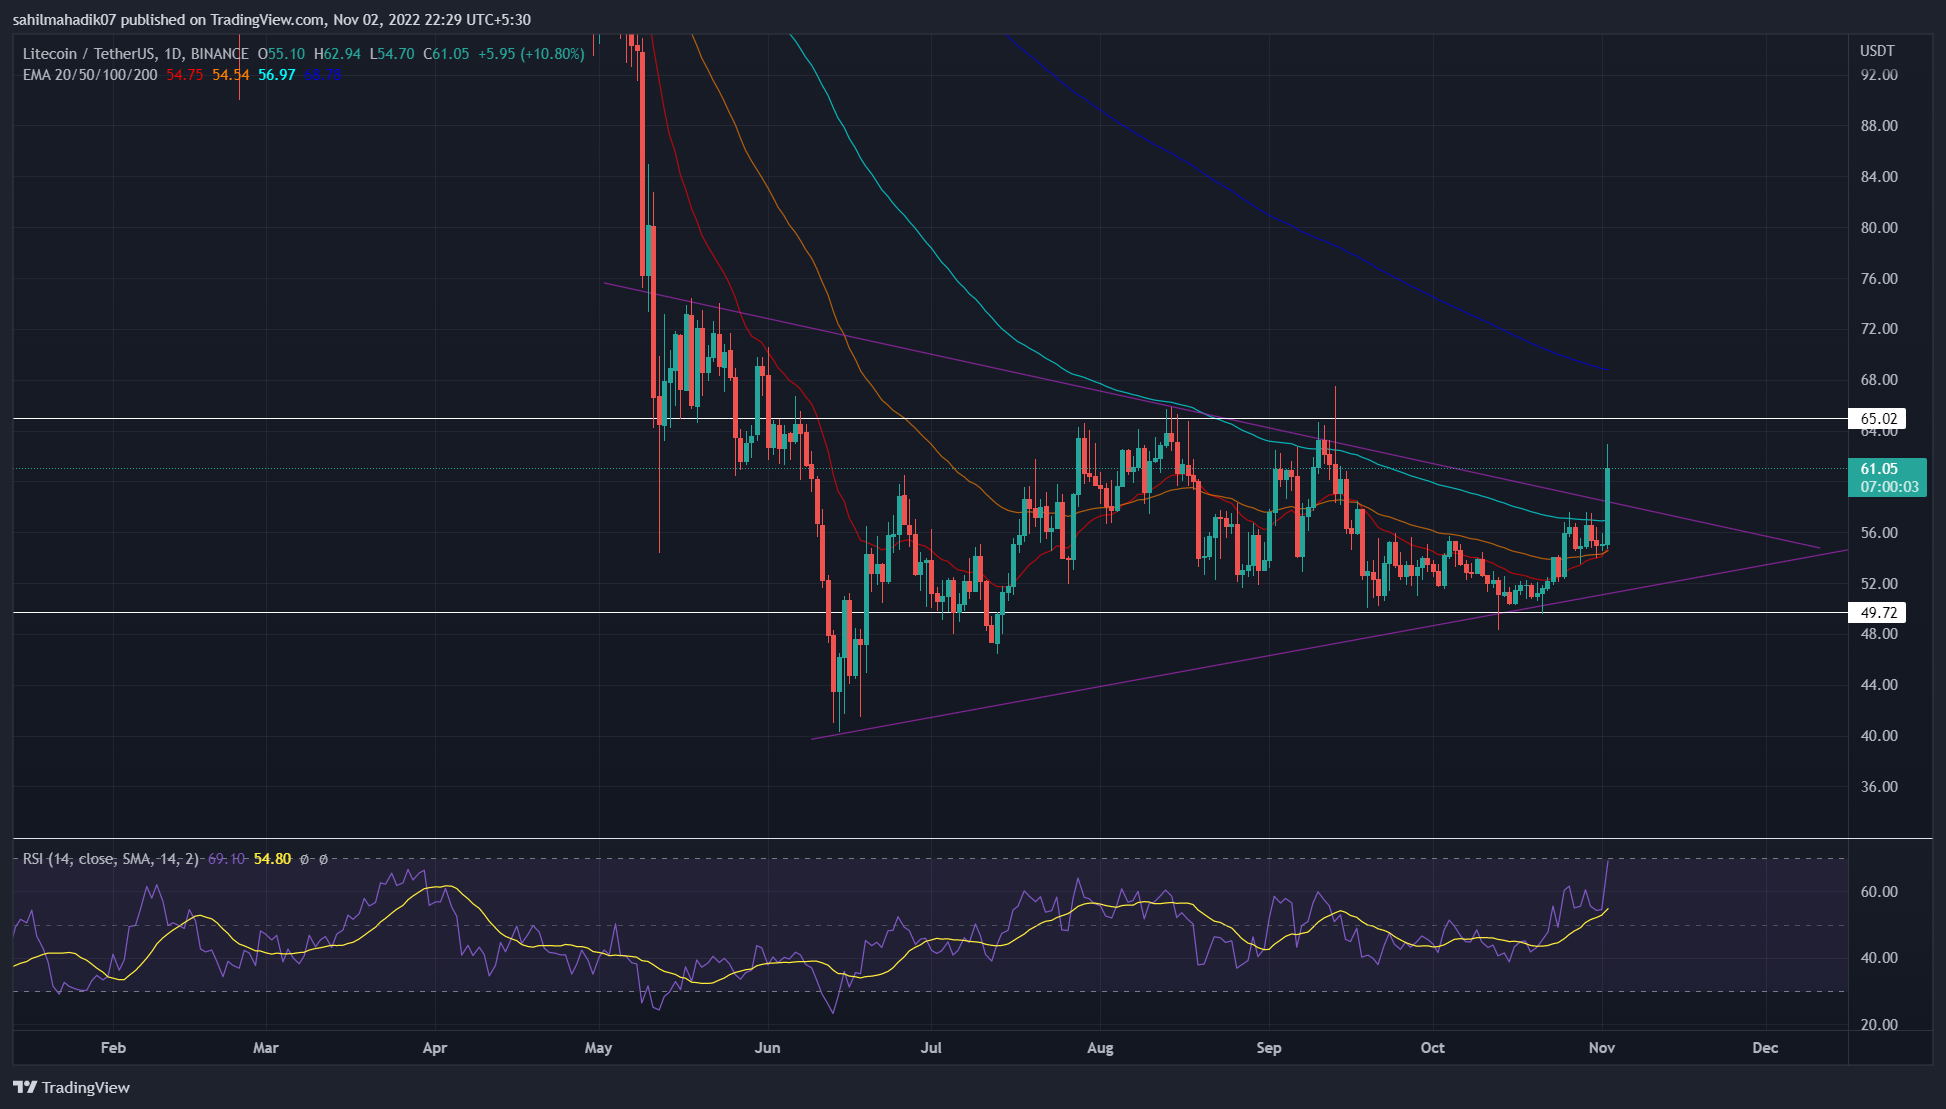
- The massive bullish candle with sufficient could jump triggers the triangle pattern breakout in the daily chart.
- A bullish rally above the 50-and-100-day EMAs encourages a bullish crossover.
- The intraday trading volume in the LTC is $1.3 Million, indicating a 184% gain.

Source- Tradingview
The Litecoin price has resonated in a symmetrical triangle pattern for the last five months. However, in response to the recent recovery phase in the crypto market, the buyers strengthened their grip on trend control, which resulted in a bullish breakout from this chart pattern.
With a 10.38% spike in the last 24 hours, the Litecoin price breached the pattern’s resistance trendline with a long bullish candle. Thus, completing this pattern on a bullish note accelerates the bullish momentum and provides an early sign of trend reversal.
Trending Stories
Moreover, the price recovery showcased sustainability above the recently reclaimed 20-and-50-day EMA. Moreover, with today’s price jump, Litecoin gained a 100-day EMA sloped, offering an extra edge for holders.

Source- Tradingview
Analyzing the weekly chart, the altcoin price action inchoates a double bottom pattern with a neckline at $64. Furthermore, the bullish breakout in the daily chart bolsters the trend reversal in the weekly timeframe. Under the influence of this pattern, the buyers should drive 6% high to aforementioned resistance.
On a contrary note, if the uptrend fails to cross the neckline at $64, a reversal will start a price correction.
Technical Indicator
Relative Strength Index: the daily-RSI slope spikes into the overbought zone, whereas the weekly RSI slope just starts an uptrend. Thus, the indicator shows a high likelihood of an uptrend with a minor correction to retest the triangle breakout.
advertisement
VI Indicator: The Bullish gap increases between the VI lines to maintain the buy signal in short to mid-term. However, the VI lines maintain the sideways noise keeping a neutral signal.
Litecoin price intraday level
- Spot price: 61.1
- Trend: Bullish
- Volatility: Low
- Resistance levels: $2 and $2.45
- Support levels: $1.7 and $1.5
Share this article on:
The presented content may include the personal opinion of the author and is subject to market condition. Do your market research before investing in cryptocurrencies. The author or the publication does not hold any responsibility for your personal financial loss.


