Published 11 mins ago
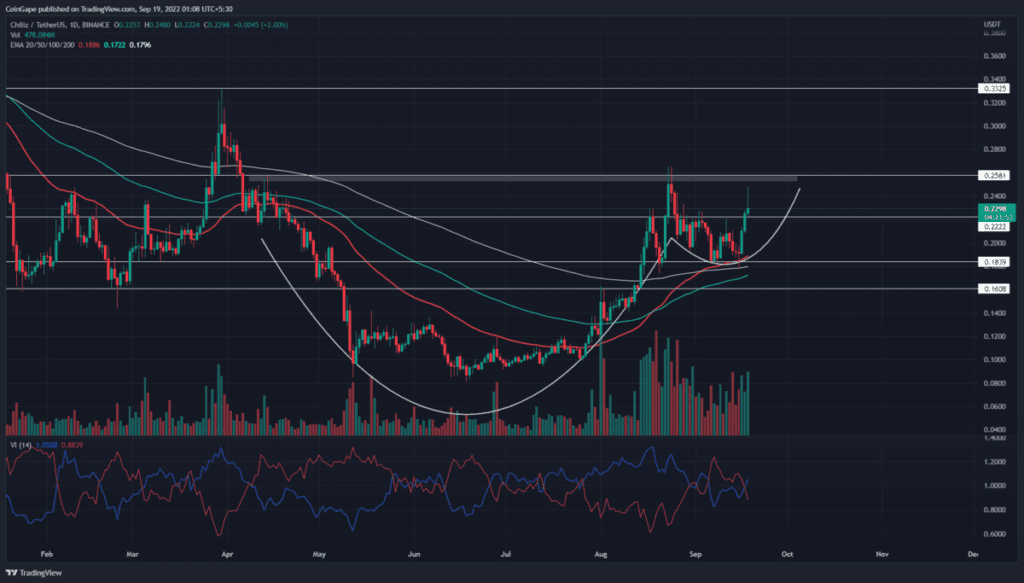
The Chiliz coin technical chart shows the cup and handle pattern formation. This bullish pattern is often spotted at the market bottom and assists buyers in extending their recovery to a greater height. Moreover, even the August second half correction bolsters for this pattern’s handle portion, which supported at $0.184. This handle portion is important for a potential recovery as it indicates the traders are buying at dips.
advertisement
Key points
- The Chiliz price recovery under the influence of cup and handle pattern
- A breakdown below $0.184 will undermine the bullish pattern
- The intraday trading volume in the CHZ is $703 Million, indicating a 1% gain

Source- –Tradingview
On September 15th, the Chiliz coin price rebounded from this $0.184 support and formed a double bottom pattern. This bullish pattern gives an extra boost to drive price recovery to higher levels. Thus, on September 17th, the buyers gave a bullish breakout from the $0.222 neckline resistance.
Earlier today, the Chiliz coin price showed an excellent follow-up for pattern breakout with a 10% intraday jump. However, a sudden selling in the crypto market offset today’s gains and reverted the prices with a long-wick rejection.
Trending Stories
Anyhow, if the coin buyers manage the daily candle closing above the $0.22 resistance, this level will flip into a suitable footing. With sustained buying, the altcoin may drive the prices higher to rechallenge the $0.251. This supply zone is the neckline for the cup and handle pattern.
Completing this pattern, with a break above the $0.258 barriers, will further accelerate the bullish momentum and drive the prices to the $3.32 mark.
Technical Indicators
Vortex indicator: the bullish crossover between the VI+ and VI- slope hints at active buying in the market and the bullish theory to breach the $0.258 neckline
advertisement
EMAs: the coin price trading above the crucial EAMs(20, 50, 100, and 200) accentuates a bullish trend. Moreover, these could assist buyers in maintaining this bull run.
- Spot price: 0.2293
- Trend: bullish
- Volatility: High
- Resistance levels- $0.258 and $0.33
- Support levels- $0.22 and $0.184
Share this article on:
The presented content may include the personal opinion of the author and is subject to market condition. Do your market research before investing in cryptocurrencies. The author or the publication does not hold any responsibility for your personal financial loss.


