$60,000, $56,800, and $54,000 have been crucial price levels for Bitcoin that sent the market in a panic mode and almost created havoc among traders. Each time BTC fell under the aforementioned price levels the chants of “buy the dip”, “Black-Friday discount” and other such positive sentiments anticipating a quick reversal popped up but the larger market’s mood seemed to tilt towards bearish.
Fear taking over
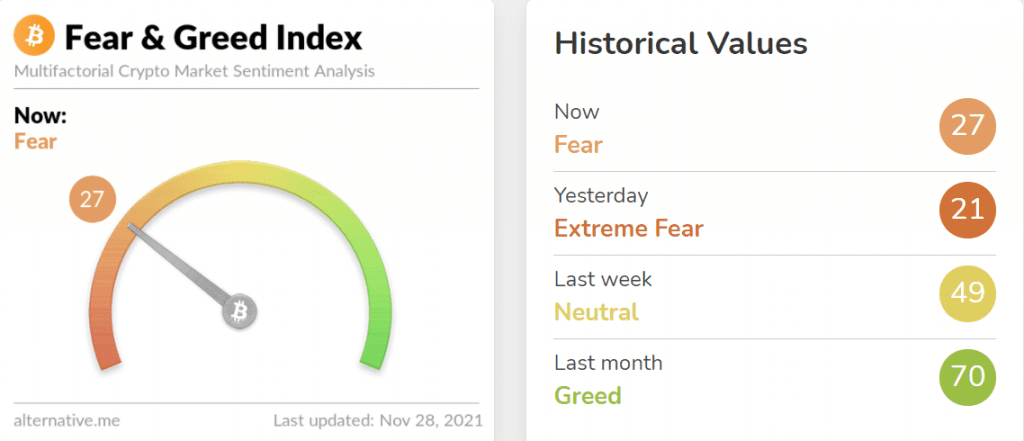
As Bitcoin oscillated at $54,366, at the time of writing, its price was merely 20% down from its all-time high, however, the market had reentered “extreme fear” for the first time since the $43K level, on 27 November, 2021.
Source: Alternative .me
BTC’s fall by $6,000 in a single day took its toll on the fear and greed Index, as the score more than halved in the same time. At the time of writing, however, with Bitcoin stabilizing just above the $54K level the indicator had returned from ‘extreme fear’ to the ‘fear’ zone. Notably, the last time Bitcoin’s spot price was around the same price levels the Fear and Greed index measured ‘extreme greed’.
Further, Bitcoin’s price and RSI on a daily chart have been in a downtrend making lower lows since 10 November. However, with funding rates still being positive despite the price fall, the same showed that the market expected a swift recovery which didn’t seem to happen yet.
So, what’s BTC up to?
For now, the leverage ratio for Bitcoin is still too high for confirming that the $53K was in fact the actual bottom in order for BTC to hit a new ATH. Analysts have anticipated more corrections taking BTC down to 53K+ price ranges or lower for confirming the actual double bottom before the price goes higher.
BTC’s price, at the time of writing, seemed to be making a falling wedge pattern, which has been seen previously too. Earlier when the same falling wedge pattern was observed towards the end of September, Bitcoin made a double bottom before starting the uptrend.
Notably, Bitcoin addresses with more than one Bitcoin were currently showing a very similar fractal that played out last year right before its price broke ATH.
If the above fractal plays out the same way it did in 2020 when Bitcoin’s price rose by almost 100%, BTC could see gains in the coming month. That being said, BTC’s supply shock ratio still painted a bullish picture for the top coin. Bitcoin’s price usually follows the Exchange Supply Shock Ratio but this time there are divergences in the same, however, the price could follow soon as accumulation rises and supply on exchanges goes down.
Bitcoin’s price has been in a falling wedge after making three lower lows and two lower highs. In the near term, however, BTC would need to pull up ahead of the monthly close. A higher monthly close would be key to BTC’s trajectory ahead even though December has usually been a bullish month for the top coin with prices shaky at the moment nothing can be said with certainty.


