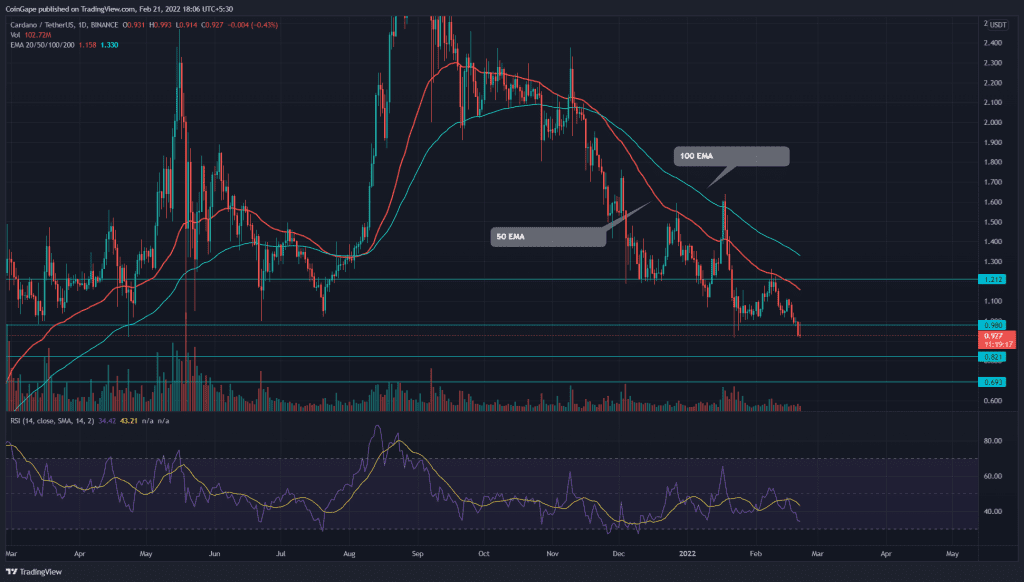
On February 20th, the Cardano (ADA) price gave a decisive breakout from the yearly support of $1. Until this breakdown, this crucial support didn’t allow a single daily candle closing in the past year. Should we expect another freefall in ADA, or do buyers have something up their sleeves?
Key technical points:
- The daily-RSI slope approaches the oversold territory.
- Higher price rejection in retest candle highlights bears power.
- The intraday trading volume in the ADA coin is $1.2 Billion, indicating a 10% hike
Source- Tradingview
The Cardano (ADA) price has traded above $1 over the past year. This crucial support was resilient even during the crypto bloodbath of June-July 2021 followed by the August rally.
Back to the present, the ADA buyers failed to overcome the $1.2 resistance during the recent recovery rally, resulting in an immediate bearish reversal. The sustained selling pulled the coin price below the $1 support, indicating a 27% loss in the last two weeks.
Following a bearish sequence, the downsloping crucial EMAs(20, 50, 100, and 200) suggest the bears are dominating the field. Moreover, the 50 and 100 EMA acts as dynamic resistance that traders are using to sell on rallies.
Moreover, the Relative strength index(33) slope sliding lower accentuates the aggressive selling in the market.
ADA Chart Hints Next Support Lies Down 12% ($0.82)

Source- Tradingview
After yesterday’s breakdown, the ADA price reverted to retest its new resistance. The coin chart displays a long higher price rejection in the daily candle, indicating the support has flipped to support.
If traders maintain the price below the $1 mark, the selling pressure would intensify and plunge the altcoin to $0.82, followed by $0.7.
Resistance levels- $1, and $1.2
Support levels-$0.8 and $0.7


