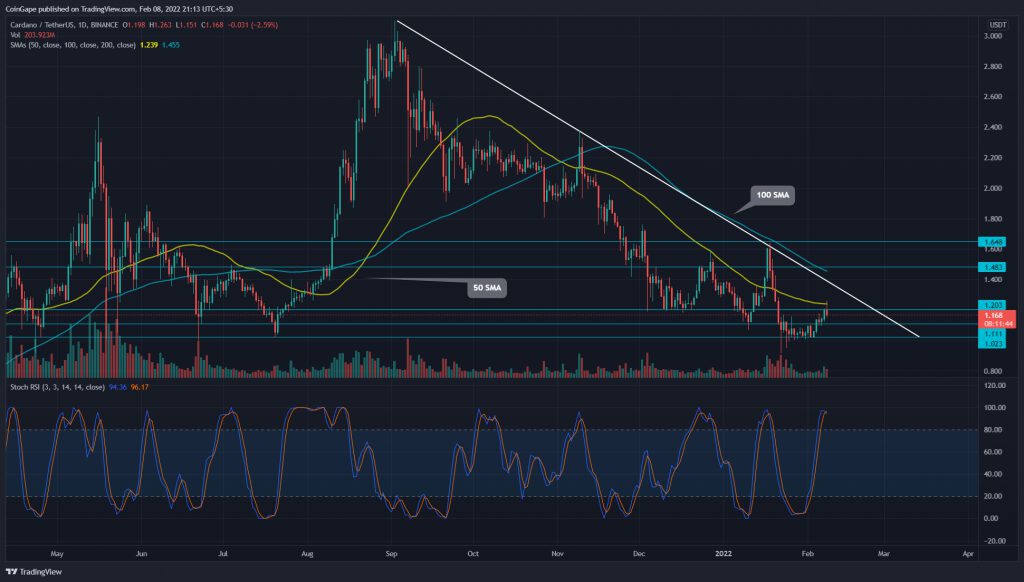
The overall trend for the ADA/USD pair is still bearish. The buyers rebounded the coin from the $1 mark, indicating a 13% gain in the last six days. However, the buyers failed to sustain the $1.2 breakout, and the resulting bull trap suggests the price would sink to $1 support. However, if buyers defend the bottom support, it indicates the bulls are buying at this dip.
Key technical point
- The ADA price resonating in a rising channel
- The ADA/USD price facing strong resistance at the 50-SMA line
- The intraday trading volume in the ADA coin is $2.39 Billion, indicating a 41% hike
Source- Tradingview
During the last two weeks, the Cardano (ADA) price wobbled in a narrow range stretching from $1 to $1.125. On February 4th, the coin buyers gave a decisive breakout from the overhead resistance, indicating a recovery rally.
The sustained buying surged the alt to the immediate resistance at $1.2, preparing for another breakout. However, the sellers mounted stiff resistance at this level and rejected the coin price with a long wick candle.
The down-sloping 50 and 100-day SMA indicates the bears are dominating. Moreover, these two EMA lines are majorly rejecting the downtrend rallies. The Stochastic RSI shows a bearish crossover of the K and D lines, indicating a sell signal for crypto traders.
A Rising Channel Emerges From $1 Support

Source- Tradingview
On the 4-hour chart, the ADA/USD pair provided a breakout and candle closing above the $1.2 resistance. The altcoin was going through a retest phase, looking for sufficient demand. However, the buyer failed to sustain at this level, resulting in a fallout.
This bull trap could slump the coin back to the $1 mark, and any further price drop could result in a downtrend continuation. However, the chart shows the formation of a rising channel pattern, which could provide mid-way support to altcoin.
- Resistance levels- $1.2, and $1.4
- Support levels-$1.12 and $1


