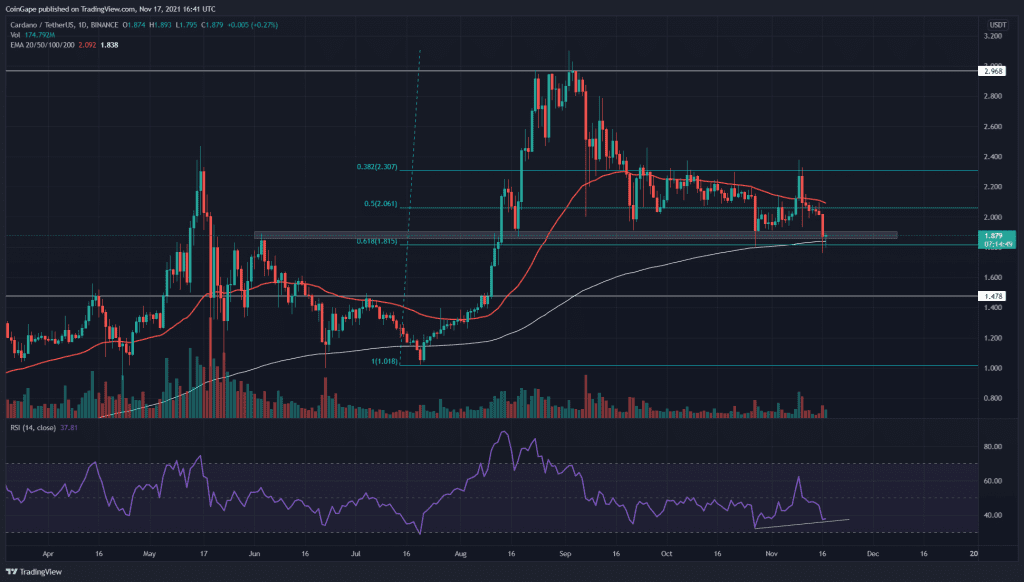
The ADA/USD price hovering above the 0.618 Fibonacci retracement level, maintaining an overall bullish sentiment. Recently, the market leader Bitcoin has dropped below the $60000 mark, adversely affecting the major altcoins, including Cardano. Check out what the price analysis says about this coin.
Key technical points:
- The ADA coin tries to sustain above the 0.618 FIB level
- The daily RSI shows a bullish divergence for ADA price
- The intraday trading volume in the ADA coin is $3.1 Billion, indicating a 3.29% hike
Source- ADA/USD chart by Tradingview
After making a New All-Time High of $3 in September, the ADA coin entered a moderate retracement phase. The coin price plunged to the 0.618 Fibonacci level, and even after retesting this support a few times, the price was still struggling to initiate a good rally. As for today, the ADA price is currently present at crucial support, which has a strong confluence of some major technical levels.
These technical levels include:
- A strong horizontal support area of $1.9-$1.82.
- The FIB level of 0.618.
- The presence of a 200 EMA line.
If the coin price dropped below the support level, the coin traders would have an excellent short opportunity for them.
The Relative Strength Index value at 37 indicates the current sentiment for this coin is still bearish. However, this chart also indicates a bullish divergence regarding the coin price, suggesting a positive turn among the market participants.
ADA/USD Chart In The 4-hour Time Frame

Source- ADA/USD chart by Tradingview
As mentioned above, the ADA coin seems to be in a make-or-break situation. The coin is present at important support and presents a slight possibility of bullish reversal with the hidden divergence in the RSI chart.
The coin traders should be patient and observe the coin price for some time. If ADA price gets sufficient demand pressure from this level, the traders can initiate a long and would also have an excellent location to place their stop loss.
.
.
.


