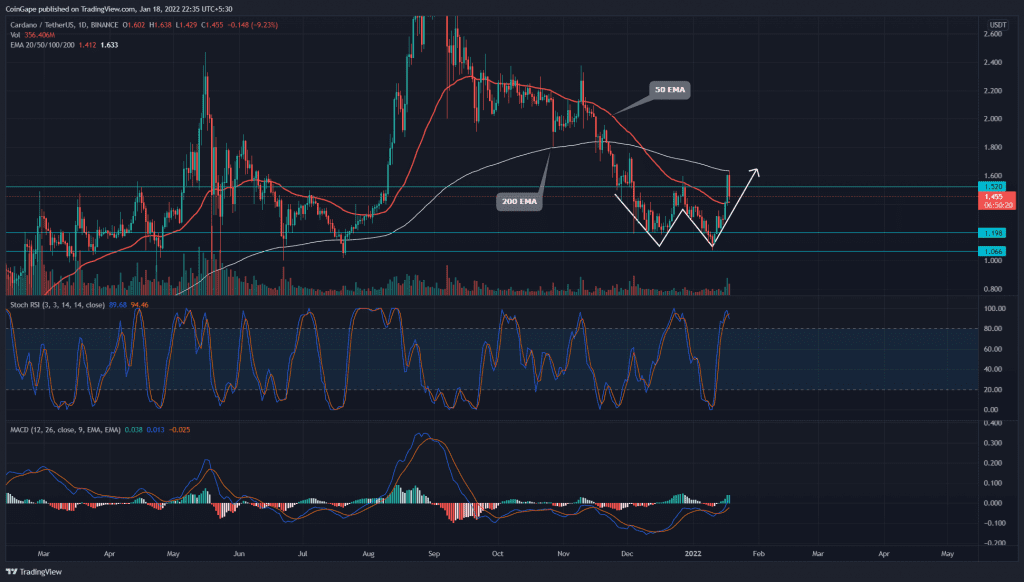
With launch of the Decentralized exchange, SundaeSwap, last Thursday, Cardano (ADA) prices are booming despite the gray clouds on the crypto-verse. SundaeSwap is the first DeX on the Cardano blockchain. The ADA price jumped more than 30% in the past week resulting in the breakout of a double bottom pattern. Therefore, the recent reversal in coin price marks a retest of the bullish breakout.
Key technical points
- The ADA coin fails to rise above the 200-day EMA
- The daily-MACD indicator reflects a rise in underlying bullish momentum.
- The intraday trading volume in the ADA coin is $4.9 Billion, indicating a 27% fall.
Source- Tradingview
In our previous coverage of Cardano price analysis, the coin price gave a breakout of the $1.5 mark. However, the price failed to sustain above the mark and gave a reversal to the $1.125.
With the newfound demand near the $1.125 mark and the launch of SundaeSwap, the ADA price shows a sparking bullish rally. The price jump leads to the bullish breakout of the double bottom pattern in the daily chart. Therefore, the recent reversal in coin price brings the retest of the pattern breakout.
Analyzing the crucial EMAs (20, 50, 100, and 200), we observe a bearish alignment in the daily chart. The 200-day EMA provides dynamic resistance to the coin price resulting in the recent reversal below the 100-day EMA. However, the 50-day EMA stands strong to push the price higher again.
Moreover, the Daily Stochastic RSI reflects the bearish crossover of the K and D lines in the overbought zone.
ADA Price Chart Shows Increasing Selling Pressure

Source- Tradingview
The ADA price fails to sustain above the $1.5 mark resulting in the increased selling pressure. Currently, the coin price hangs close to $1.45, with a daily downfall of almost 10%.
The MACD indicator shows the signal and the MACD line head higher to the zero line mark in the daily chart. The increase in the bullish histograms reflects a rise in underlying bullish momentum.
- Resistance levels- $1.5 and $2
- Support levels- $1.125 and $1


