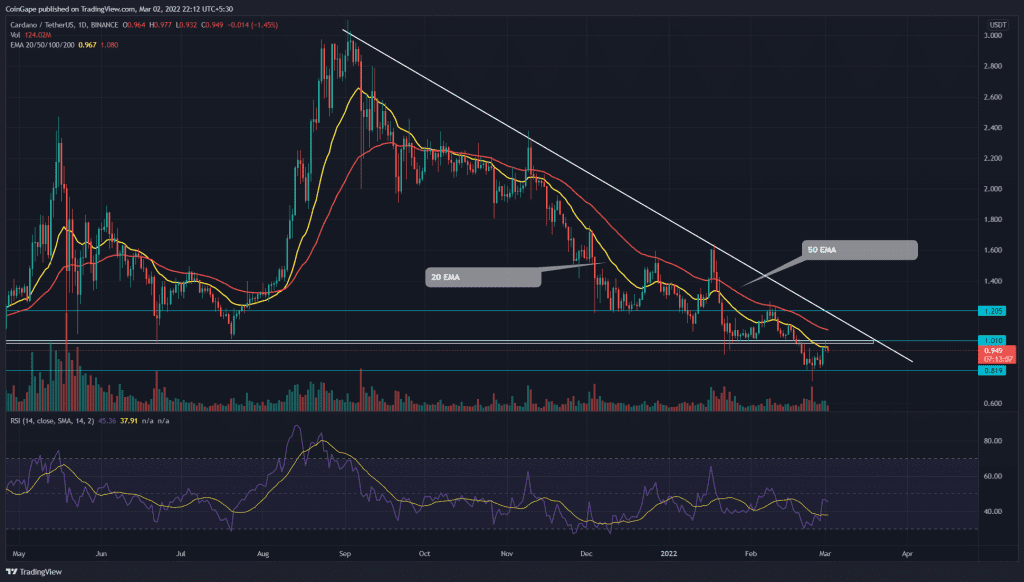
On February 28th, the Cardano(ADA) price broke its sluggish movement over the $0.8 support, with a 12.5% intraday pump. The buyers rechallenge $1 flipped resistance to build upon the underlying bullishness in the market. However, the path to ADA recovery shows more than one hurdle.
Key technical points:
- Cardano price forming an evening star candle at the $1 resistance
- A descending trendline governs the downtrend
- The intraday trading volume in the ADA coin is $1.3 Billion, indicating a 31.2% loss
Cardano Price Daily Chart
Source- Tradingview
Over the past week, the ADA/USDT pair was majorly hovering above the $0.8 support. The several lower price rejection candles at this support indicated the buyers are aggressively defending this level.
On February 28th, the ADA price showed intraday 12.5% gain, reaching the immediate resistance of $1. Concerning yesterday’s Doji candle(Feb 29th), the coin turns red today, forming an evening star candle pattern.
This bearish reversal candle pattern suggests that once a crucial support level, i.e., $1, has flipped to resistance. If sellers hold Cardano price below this mark, the selling pressure would gradually rise and dump the coin by 14%($0.8).
Alternatively, if buyers manage to breach the overhead resistance, the coin holders would get their first sign for recovery.
However, a breakout and closing above a long coming descending trendline is a must for approaching a trend reversal.
Technical Indicators
The 20-day EMA assists the sellers in mounting a strong resistance at $1. Moreover, the 50 and 100 EMA acts as dynamic resistance in this downtrend.
The Relative strength index(45) slope turned down from the midline, maintaining a negative sentiment among the coin traders.
- Resistance levels- $1, and $1.2
- Support levels-$0.8 and $0.7


