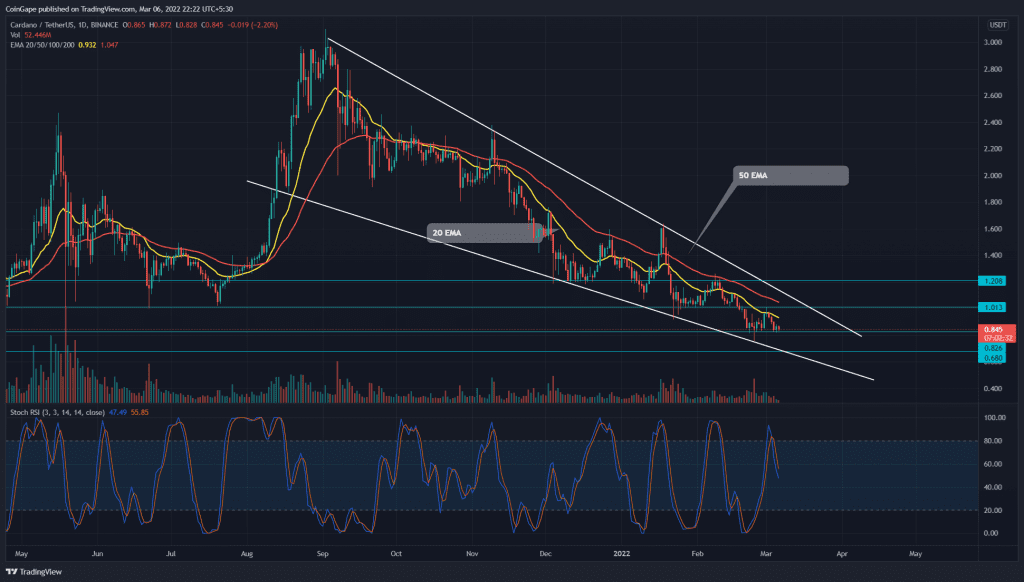
On March 1st, the Cardano (ADA) price was rejected from the $1 psychological level with an evening star candle pattern. The sellers sank the altcoin back to weekly support of $0.82. Can sellers extend this sell-off to newer levels, or would buyers step in to seize control from them?
Key points
- The ADA price retest the lower lows support $0.83
- A falling wedge pattern governs the ADA price action.
- The intraday trading volume in the ADA coin is $613.70 Million, indicating a 31.6% loss.
Source- Tradingview
On February 18th, the ADA buyers lost their crucial yearly support of 1$ Mark. The sellers pulled the altcoin to the $0.825 level, followed by a retest phase to validate their new flipped resistance of $1.
The renewed selling pressure has slumped the altcoin by 18.3%, retesting the lower low support of $0.82. A breakdown below this mentioned support would indicate a resumption of the downtrend, threatening another 17.6% drop before the price reaches $0.678.
Contrary to the above assumption, a bullish reversal from the $0.86 mark would indicate the traders are accumulating at this dip and would surge the price to immediate resistance of $1.
However, a breakout and sustainability from the falling wedge pattern is necessary to initiate a genuine recovery in Cardano(ADA).
Technical Indicator
The 20-day exponential moving average (EMA) facilitates the sellers in defending the $1 resistance. At the same time, the 50 EMAs act as dynamic resistance in this downtrend.
The Stochastic RSI indicator shows a bearish crossover among the K and D lines, encouraging the sellers to extend the downtrend.
- Resistance levels- $1, and $1.2
- Support levels-$0.82 and $0.68


