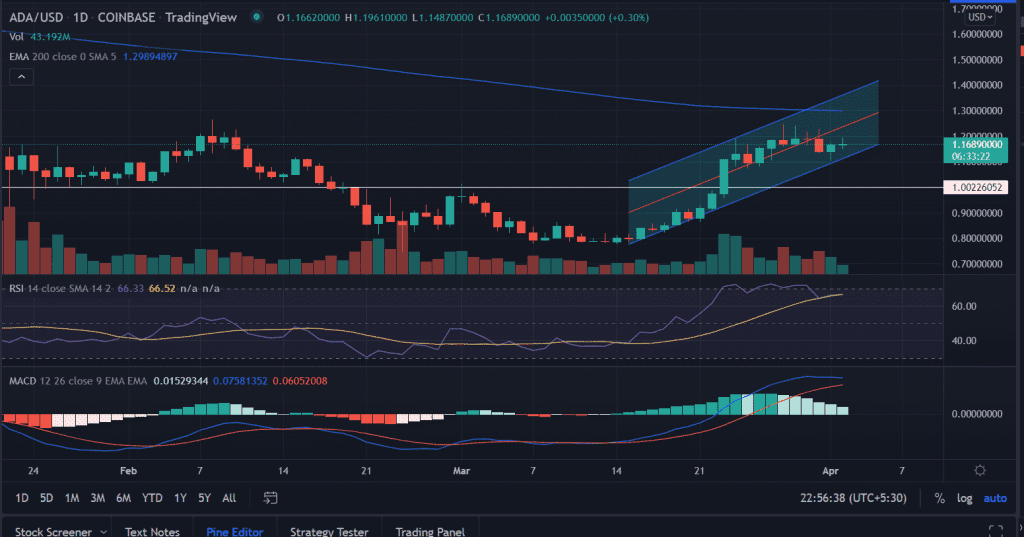
ADA price continues to slide in a predefined range since the beginning of the week. The price opened lower but quickly recovered to test the session’s highs near $1.19. But failed to sustain the gains.
- ADA price trades in a very tight range with no meaningful price action.
- A decisive close above $1.20 will make bulls hopeful.
- The price trades inside the parallel channel with rising lows.
As of writing, ADA/USD trades at $1.16, up 0.17% for the day. The 24-hour trading volume of the ninth-largest cryptocurrency holds at $1,198,494,550 with a loss of 35%.
ADA price trade sideways
On the daily chart, ADA price faces rejection near $1.25, the price tested the highs as the week begins. However, the bulls lack the conviction to carry forward the gains as the price retreated to test the lows of 1.10 in the previous session. But, the downside remains limited as ADA price bounced back towards 1.20.
In addition to that, the asset trades inside the ‘parallel’ channel with rising lows. The pattern is bullish but needs to give a daily candlestick above 1.20.
The first upside target could be found in the 200-day EMA (Exponential Moving Average) at $1.30. Further, the sustained buying pressure would push the price towards the vital $1.40 level.
On the flip side, if the price revisits the previous session’s low then it will invalidate the bullish theory for the asset. A break below $1.10 will intensify the selling toward the horizontal support level at $1.0.
Technical indicators:
RSI: The daily Relative Strength Index hovers just near the average line with no clear stance. An uptick in the indicator could strengthen the upside outlook in the price.
MACD: The Moving Average Convergence Divergence recedes from the higher levels. Still holds above the central line.


