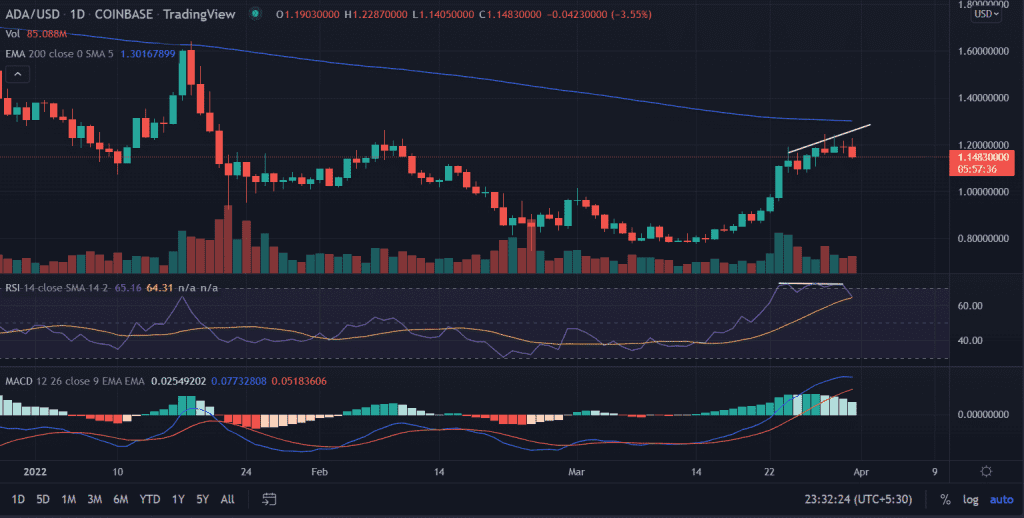
ADA price finds strong resistance near the $1.20 level as the price failed to move beyond the level for the past three-four sessions.
- ADA price edges lower with significant losses on Thursday.
- The bulls failed to move above $1.20 indicating the lack of conviction among buyers.
- The RSI shows a negative divergence on the daily chart
ADA price consolidates
ADA price continues to trade sideways near the higher levels with minimal losses. The support-turned-resistance $1.15 remains a critical level to trade. Increased selling pressure could result in a pullback in the price in the short term at least.
If the price breaks below $1.15 on a daily closing basis then it could test the psychological $1.0 level. This would be a major setback for the bulls.
An extended sell off-could further exploit the lows of March 23 at $0.95.
On the flip side, a shift in the bullish sentiment and if the price is able to sustain the session’s lower level would make bulls hopeful. On moving higher, the first upside target could be found at $1.25.
Next, market participants would approach the critical 200-EMA (Exponential Moving Average) at $1.30.
As of press time, ADA/USD is trading at $1.15, down 3.28% for the day. The eight-largest cryptocurrency by the market cap is standing at $1,669,029,044 with 16% gains.
A rise in volume with a decline in price is a bearish sign for the price.
Technical indicators:
RSI: The daily Relative Strength Index still trades above the average line. However, it retraced from the higher levels. The indicator shows negative divergence with the price that indicates an impending bearish momentum in the asset.
MACD: The Moving Average Convergence Divergence holds above the mid-line but with a receding bullish sentiment. A downtick in the oscillator would strengthen the negative outlook for the price.


