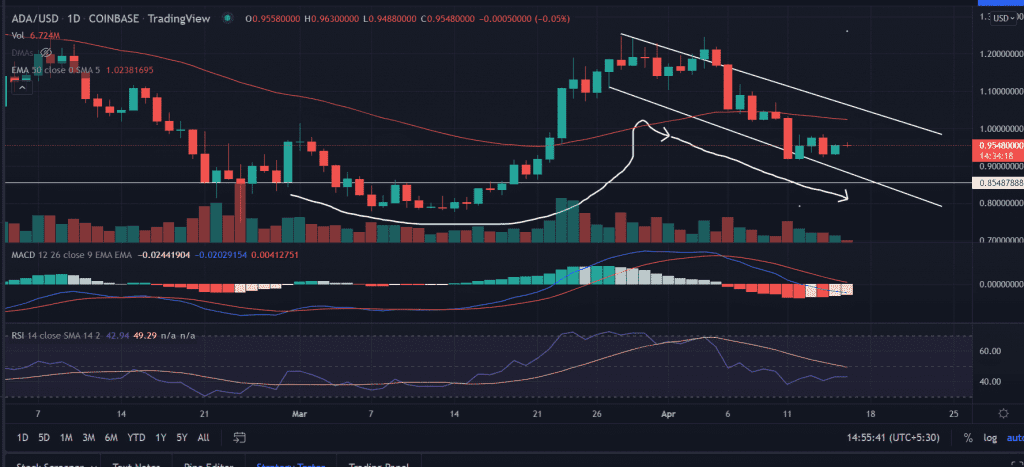
ADA price is consolidating near a short-term resistance zone. The price oscillates near a critical resistance zone. If the price manages to hold it would trigger a massive uptrend. Investors might look out for the dip-buying opportunity.
- ADA price trades with modest gains while slides in limited price action.
- More gains if the price closes above the 50-day EMA at $1.02.
- A bullish formation on the daily chart inspires the side-lined buyers to dig into the buying opportunity.
On the daily chart, the ADA price completed a ‘Cup and Handle’ formation. After tagging the swing highs near $1.24, the price made a healthy retracement of nearly 26%. A renewed buying pressure would push the price toward a higher trajectory.
On moving higher, the first upside target could be found at the 50-day EMA (Exponential Moving Average) at $1.02. Next, the market participants would flex their muscles toward the highs of April 7 at $1.11. This also coincides with the upper trend line of the formation.
While things look positive for the bulls. However, a fall below the session’s low would invalidate the bullish outlook for the pair. In that case, the downside support could be located at $0.95.
A spike in sell order would further drag the price toward the horizontal support line at $0.85.
Trending Stories
As of press time, ADA/USD is exchanging hands at $0.95, down 0.04% for the day. As per the CoinMarketCap, the 24-hour trading volume of the eight-largest cryptocurrency by the market cap is holding at $490,037,557.
Technical indicators:
RSI: The daily relative strength index holds below the average line with a neutral stance. Currently, it reads at 42.
MACD: The moving average convergence divergence slips below the midline. An uptick in the indicator would advocate for an upside outlook.


