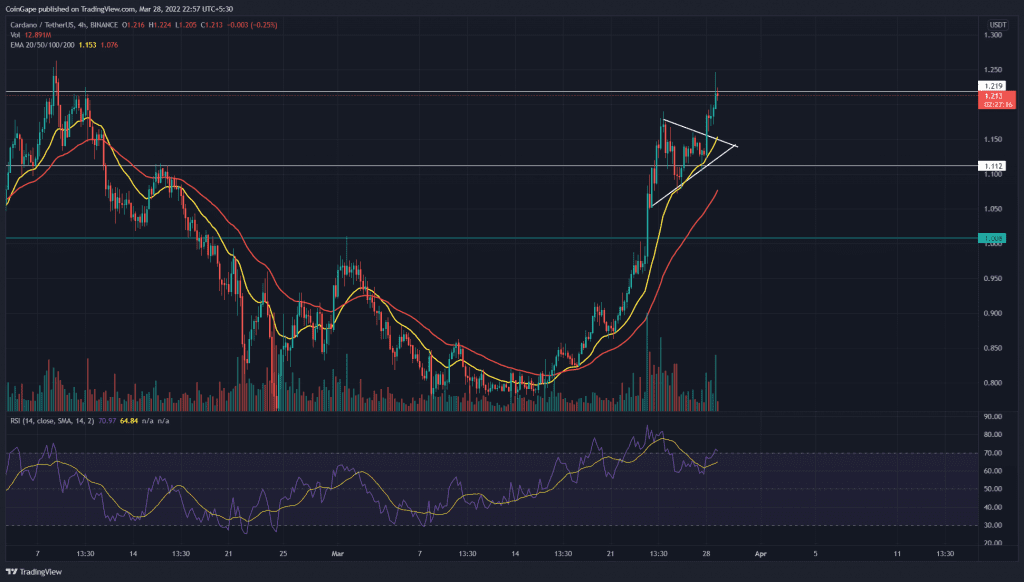
The flag pattern breakout has inflated the Cardano (ADA) price by 40% within a week. The rally surpasses the $1.20 mark, with the surge in buying pressure indicating a potential uptrend continuation.
Key points:
- ADA price shows a flag pattern’s bullish breakout.
- The RSI slope reenters the overbought zone.
- The intraday trading volume in the ADA coin is $2.18 Billion, indicating a 98% rise.
Source- Tradingview
With the demand surge in the ADA/USDT pair near the $0.85 mark, the rally breaks multiple resistance levels before creating a triangle near $1. The triangle leads to a flag pattern in the 4-hour chart, in which the recent 5% jump in the last 24 hours gives a bullish breakout.
The breakout rally hints at a bullish continuation despite the higher price rejection from the $1.25 mark. Moreover, the increased trading volume ensures a sustained buying phase for at least $1.28 with the possibility of a $1.17 retest.
The breakout rally might surpass the $1.28 horizontal level, resulting in a 22.6% price jump to the $1.5 mark.
Best optionsEarnEarn 20% APRClaim5 BTC + 200 Free SpinsWalletCold Wallet
Alternatively, the higher price rejection at $1.25 threatens an increased selling activity that might result in a downfall below the $1.17 mark to the psychological barrier of $1.
Technical Indicator
The ADA rally obtains constant support from the 20- EMA line. Moreover, a bullish alignment among the crucial EMAs(20, 50, 100, and 200) suggests the bulls maintain an upper hand in this short-term rally.
The ADA price triggered the bullish continuation pattern despite an evident bearish divergence in the RSI chart. The indicator slope has started to rise again, approaching the overbought region.
- Resistance levels- $1.2, and $1.6
- Support levels-$1 and $0.78


