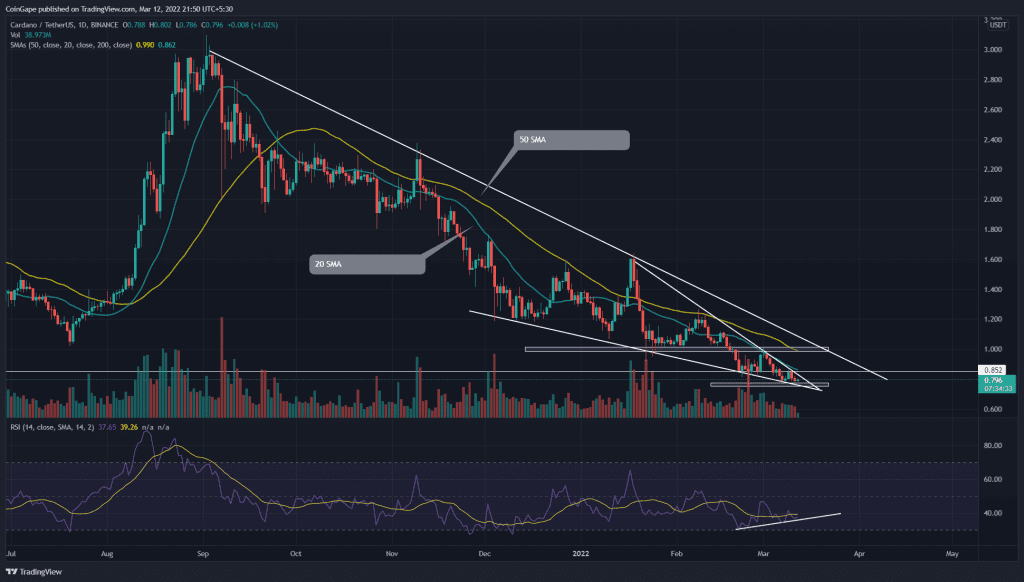
The Cardano (ADA) price is trapped within a falling wedge pattern for almost two months. The coin price is close to the pattern’s apex and is poised to give a breakout. The winning party of this tug-of-war will lead the next rally in ADA price.
Key points:
- The daily-RSI chart shows a bullish divergence
- ADA price approaching the wedge pattern’s apex
- The intraday trading volume in the ADA coin is $613.70 Million, indicating a 31.6% loss
Source- Tradingview
On March 1st, the Cardano(ADA) price retested the $1 breached support. The coin price rejected from this level with an evening star candle pattern indicates the prior support has flipped to resistance,
The bear cycle tumbled the altcoin by 20%, retesting the January low support near $0.77. Furthermore, the technical chart shows the ADA price is nearing the apex of the falling edge pattern. The coin price could surge 22%($1) if buyers take advantage of this reversal pattern and break the overhead trendline.
The possible rally would allow buyers to rechallenge shared resistance of the $1 psychological level and long-coming trendline. A follow-up breakout is a key required to expect a bullish recovery.
Contrary to the above assumption, if sellers breached the support trendline of the wedge pattern. The selling pressure would intensify and dump the coin to the $0.685 mark.
Technical Indicator
The declining SMA(20, 50, 100, and 200) projects a strong downtrend. Moreover, the 20-and-50-day SMA provides dynamics resistance to price.
The Daily-Relative Strength indicator shows a positive divergence concerning the last three swings low in price action; this indicates the increasing underlying bullishness in the coin, suggesting a bullish breakout.
- Resistance levels- $0.855, and $1
- Support levels-$0.85 and $0.76


