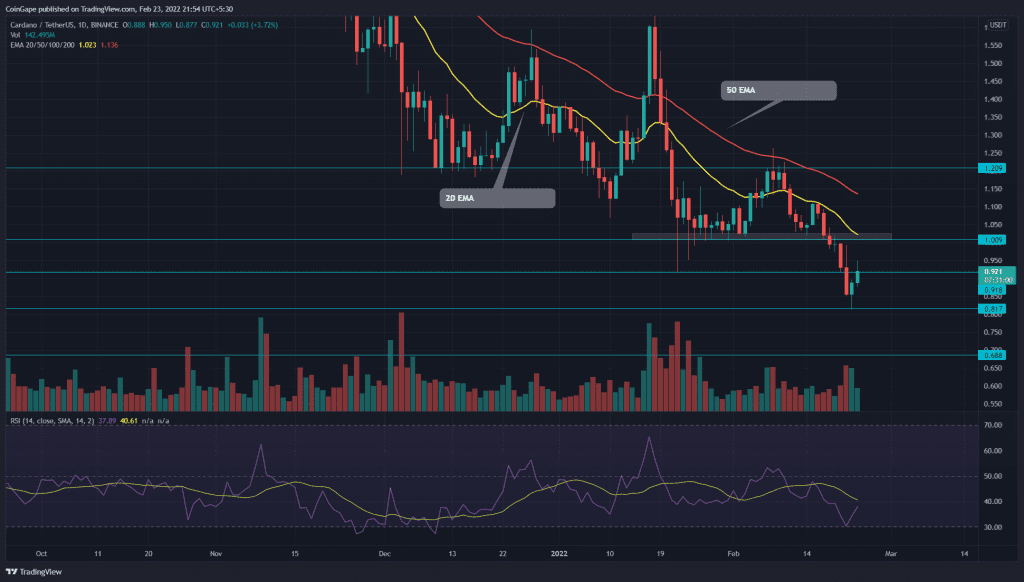
The ongoing bear trend marks a new lower low at the $0.817 mark, the Cardano (ADA) price reverts with a bullish hammered candle, attempting to surge above the $0.92 mark. However, the sellers mount a stiff resistance at the $1 mark, where the crypto traders could break even their loss traders.
Key technical points:
- The daily-RSI slope dodged from entering oversold territory.
- The intraday trading volume in the ADA coin is $1.59 Billion, indicating a 31.5% loss.
Source- Tradingview
Amid the recent sell-off in the crypto market, the ADA price extends its losses to sub $1 for the first time since February 2021. On February 18th, the sellers gave a bearish breakdown from this bottom, accelerating the selling pressure.
After a single retest day, the follow-up down rally dumps the altcoin to 18% to $0.81. However. A hammer candle on February 22nd indicates the buyers are defending this support and would attempt to drive the price higher.
The ADA/USDT technical chart shows the 20-and-50-day EMA are majorly rejecting the downtrend rallies. Moreover, ADA bears reclaim a bearish sequence among these crucial EMAs(20, 50, 100, and 200).
Moreover, the Relative strength index(33) slope reverted from the oversold neckline and currently is charging towards the midline.
ADA Buyers Struggles At $0.92 Resistance.

Source- Tradingview
The ADA chart shows two overhead resistance along the bullish path, i.e., $0.92 and $1. The coin buyers bounced back from the $0.817 mark rallied 12.3% to $0.92 resistance. However, the higher prediction at this level indicates intense supply pressure, which could drive the price below the currently lower low (0.817).
Anyhow, if buyers breached this close resistance, the $1 mark stands as the ultimate test for them before a genuine bullish rally could start.
- Resistance levels- $0.92, and $1
- Support levels-$0.8 and $0.688


