Disclaimer: The findings of the following analysis are the sole opinions of the writer and should not be considered investment advice.
The Vasil upgrade was announced to be a success by IOHK. This upgrade “will bring significant performance & capability enhancements”, and IOHK described it as the most ambitious program of work they’ve undertaken.
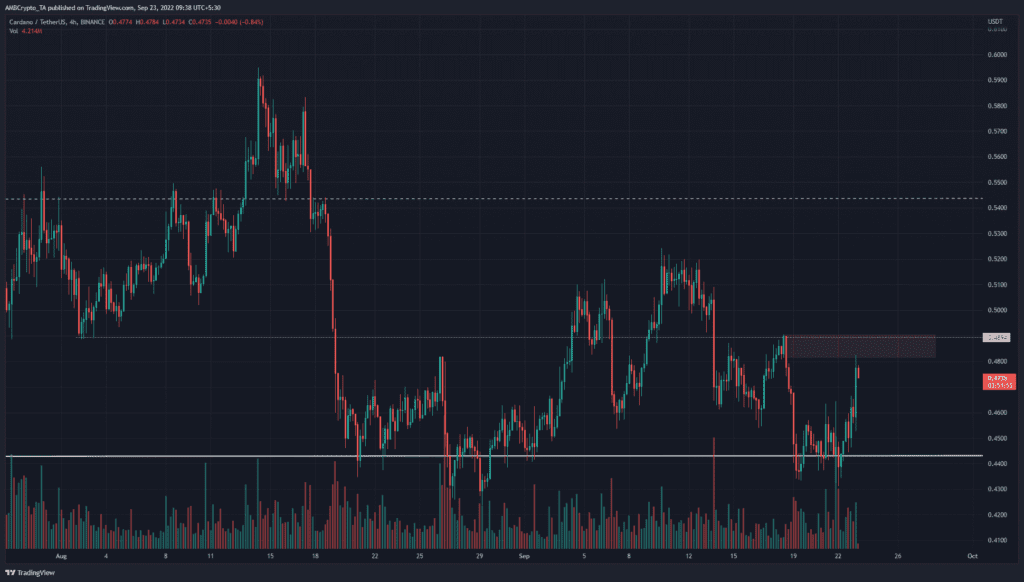
On the price charts, the past few days have seen the price register sizeable gains. The possibility of a sharp pullback for Bitcoin [BTC] threatened the idea of further gains for Cardano [ADA]. Cautious traders can wait for a strong trend to establish and trade in its direction. At the time of writing, the $0.49 region loomed as a strong resistance, while $0.44 and $0.46 were support zones.
ADA- 4-Hour Chart
The four-hour chart formed lower highs over the past two weeks. It broke above the $0.46 mark a couple of days ago. ADA approached a zone of resistance at $0.49, and this level has been key since early August.
Until a trading session closes above $0.49 on the H4 timeframe, the idea would be to sell any retest of the $0.48-$0.49 mark. A dip lower can then be awaited to enter long positions.
Rationale
The one-hour chart and its indicators showed bullish promise in the short-term. While a rejection from $0.48 could occur over the next few hours, the charts also showed the $0.455 region to be a strong support.
The Awesome Oscillator (AO) made higher highs over the previous trading day in response to Cardano’s recovery from $0.43. The Accumulation/Distribution (A/D) line also advanced over the past few days to form higher lows.
The $0.49 resistance zone can be used to take-profits. A dip to the support region (cyan box) can be used as a buying opportunity.
Conclusion
A rejection at $0.49 does not necessitate a sharp plunge. If Bitcoin can climb past the $19.6k mark, ADA can likely climb past $0.49 as well. Given the uncertain market conditions, small position size and low risk (0.5%) would be recommended. $0.49 and $0.51 can be considered resistance zones on a move up.


