An analysis of Bitcoin Sentiment revealed a substantial improvement in the overall perception from ‘extreme fear’ to ‘neutral’ over the last month. Further, the correlations of other alts to Bitcoin also improved during this time.
As a result, Cardano, Shiba Inu, Binance Coin and Terra depicted a bullish advantage on their near-term technicals. Nevertheless, the overall directional trend still needed to improve for a strong bullish rally.
Cardano (ADA)
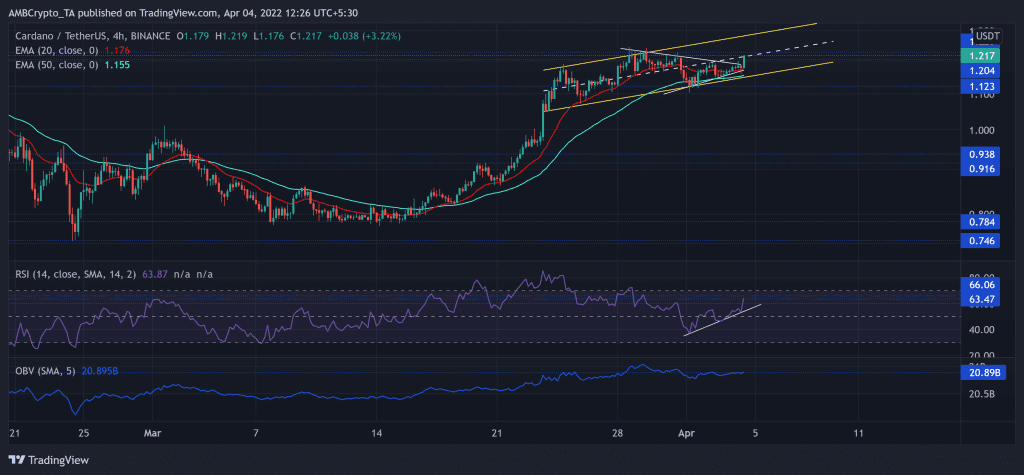
After touching its one-year low on 24 February, ADA saw a 62%+ recovery. Consequently, it reclaimed the $1.2-mark. Over the past two weeks, the continued its up-channel (yellow) oscillation while the bulls steered the trend in their favor.
After losing its 20 EMA (red) for a brief time, ADA bulls quickly flipped it from resistance to support after the recent rally. Further, the alt witnessed a bullish pennant over the last five days. The 24-hour gains propelled a breakout as it eyed to test the $1.2-resistance.
At press time, ADA traded at $1.217. The RSI grew exponentially from 1 April whilst its support trendline stood sturdy. From here, the immediate resistance stood in the 63-66 range. Interestingly, the OBV could not match the price movements in the last two days as it saw a weak bearish divergence.
Shiba Inu (SHIB)
Despite the vigorous bearish rally, the buyers upheld the $0.018-mark, as they have for the last five months. Since its January lows, SHIB bulls initiated a 104% rally before falling from its long-term ceiling of $0.034-level (for simplicity, price is multiplied by 1000).
Since then, the sellers influenced the peaks while the bulls pushed for higher troughs. Thus, forming a symmetrical triangle-like pattern in the last few days. Now, immediate support continued to stand near the 50 EMA (cyan).
At press time, SHIB traded at $0.0266. The RSI managed to cross the mid-line but was yet to challenge the 56 resistance. Also, the ADX was on constant downfall as it displayed a substantially weak directional trend for SHIB.
Binance Coin (BNB)
After witnessing a bearish pattern on a longer timeframe, BNB broke down from the vital $512-mark. Since then, it witnessed numerous sell-offs that finally halted at the $324-floor.
The alt saw a strong trendline resistance (yellow, dashed) (now support) on its 4-hour chart. The bulls initiated a recovery from BNB’s five-month low on 24 February. As a result, the alt was up by nearly 38% over the last 40 days. Furthermore, the 20 EMA (red) offered sturdy support after jumping above the 50 EMA (cyan).
At press time, the BNB traded at $447.2. The RSI marked lower peaks in the last four days while the price managed to find higher highs. This trajectory revealed a bearish divergence.
Terra (LUNA)
LUNA’s two-month low coincided with the 61.8% Fibonacci support. Thus, the bulls could gather enough force to propel a rally above the $100-zone.
After an over 140% growth from the February lows, LUNA continued its gradual upturn after marking bullish trendline support (white, dashed). A pullback from here would continue to find testing support at the 50 EMA (cyan).
At press time, LUNA was trading at $114.32. The bullish RSI hovered above the mid-line after facing resistance at the 66-mark. Also, the CMF reaffirmed a bullish edge after jumping above the zero-line.


