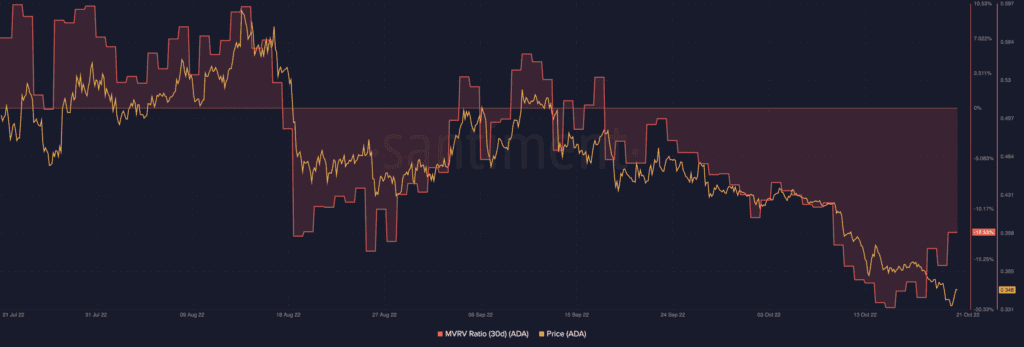
Cardano [ADA] recorded a new lowest realized value as indications of being an undervalued asset reappeared. According to Santiment, ADA last recorded such in January 2019. Interestingly, the ADA price doubled after the 2019 low position.
📊 #Cardano now sits at its lowest relative position compared to its realized value since Jan, 2019. This is a sign of undervaluation based on average trader losses. $ADA‘s price doubled the following 3 months the last time its MVRV Z-Score hit this level. https://t.co/D8Bwk2GWEB pic.twitter.com/gnOuGVqqOq
— Santiment (@santimentfeed) October 22, 2022
Here’s AMBCrypto’s Price Prediction for Cardano for 2022-2025
With its Market Value to Realized Value (MVRV) Z- score at -1.35, ADA investors might hope that the turns of 2019 happen again in 2022. But were other indications in pole position with the signals of the undervalued state?
Probably ready to follow
As the Z-score indicated a possible price uptick in the coming months, the MVRV ratio seemed to follow. Santiment data showed that ADA’s thirty-day MVRV ratio was -20% on 15 October. At that rate, it indicated that investors were far off from making profits, not to mention double ROI of their holdings.
At press time, the MVRV ratio had moved up remarkably to -12.53%. While this was no assurance that profit was on its way, it might agree with the possibility of a price increase in the mid-term.
Of course, it might be a reach expecting ADA to double in price. At the same time, it was not impossible especially with ADA increasing to $0.35 from the previous day value. Based on CoinMarketCap data, the price rise was 4.14%, making a significant increase from its dip to $0.33 on 21 October.
In addition to the MVRV ratio, ADA investors could also observe the price trend. As such, ADA’s price might be making moves of its potential uptick. This was revealed by the state of the daily active addresses. Santiment data showed that the daily active addresses were 69,500 as of this writing. Hence, these investors could be ready since recording increases since 19 October.
However, it might mean “jumping into conclusion” without considering the ADA momentum and price action.
Where next from here?
A look at the charts showed that ADA was in an excellent momentum. The Relative Strength Index (RSI) was at 47.92, with signs of a further increase. At the current rate, ADA sustaining the buying momentum could raise the price much higher than $0.35.
In addition, the Bollinger Bands (BB) revealed that ADA could be on the verge of a price spike. The BB indicated that the coin might leave the low volatility region. If so, the increasing support zone from $0.333 to $0.346 could drive ADA higher in the short-term.
As for the Moving Average Convergence (MACD), ADA might need more than the spring buying momentum to succeed in the price hike objective. With both buyer strength (blue) and sellers (orange) remaining below the histogram, investors might need to exercise a little more patience before a guaranteed rally.


