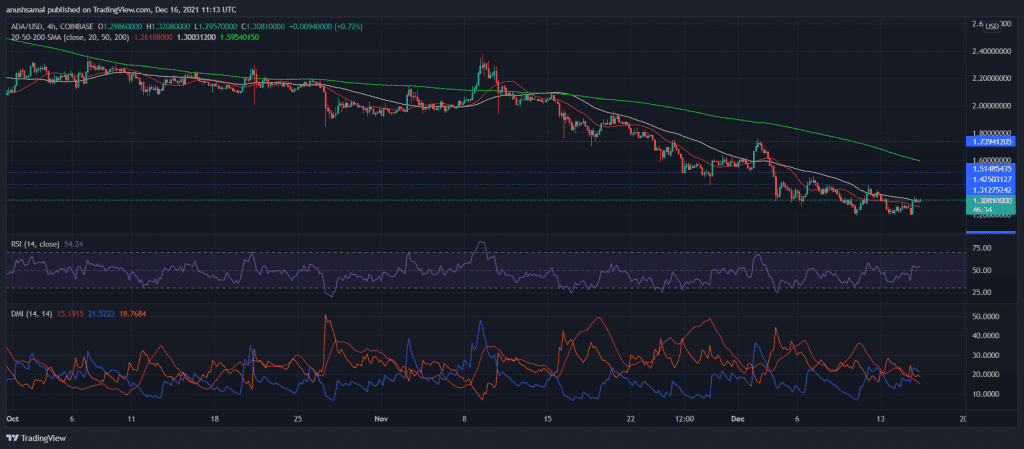
The broader market reversed its bearish sentiments over the last 24 hours, and the effect was seen across the cryptocurrency industry. Due to the same phenomena, Cardano, XRP, and Chainlink have also logged in gains.
At press time, ADA was trading for $1.30 after appreciating 5.8% over the last day. With a continued bullish stance, the coin would soon topple over the immediate price ceiling of $1.31. Near-term technicals of Cardano appeared bullish.
Cardano/ADA/USD Four-Hour Chart
Cardano broke off its bearish streak and was eyeing to trade above its multi-month support line of $1.51 at the time of writing. Over the last week, Cardano lost 6% of its value. However, the previous 24 hour gain has successfully reversed most of the alt’s losses in the past week. ADA must remain above the $1.30 mark as that level has acted as a robust ceiling that had rejected the bulls multiple times over the past week.
From the technical indicators, there seems to be hope as buying strength re-surfaced in the market; previously intense selling pressure stopped the bulls from surpassing the level mentioned above. The Relative Strength Index displayed bullish sentiments as the indicator shot northwards. The Directional Movement Index implied a buyer’s market and put forth a solid directional trend. Regarding the same, the bulls have pushed the prices to stand above the 20-SMA line. On the flip side, the immediate support level of ADA rested at $1.26.
XRP/USD Four-Hour Chart
XRP shot up by 3% over the last 24 hours and was priced at $0.82 at the time of writing. Although XRP’s bulls have brought in some respite, the coin has encountered considerable resistance at the 23.6% Fibonacci level. If the bulls sustain themselves, then XRP has a shot at surpassing the $0.91 price ceiling. The alt’s price direction has been in line with the general trend of the market; for instance, after trading inside the descending channel, the token continued its southbound travel.
The technicals suggest that XRP might trade bullishly on a short-term time frame. The Relative Strength Index was slightly above the half-line. Buyers invariably dictated price momentum as the coin’s prices stood above the 20-SMA line. Lastly, The Average Directional Index was parked below the 20-mark, a reading that indicates chances of consolidation. In the case of sideways trading, XRP could be expected to trade between $0.74 and $0.91 levels, respectively.
LINK/USD Four-Hour Chart
Chainlink’s price stood at $19.89 after an upswing that brought double-digit gains for the coin. The token’s solid resistance mark was at the 23.6% Fibonacci level. This break from Chainlink downward price action is reflected in its technical indicators. The rise in prices could push LINK to trade above its price resistance of $22.04, even though the bulls had attempted to test the abovementioned levels multiple times only to face rejection right after.
Buying pressure has finally risen above the midline, as the Relative Strength Index hints at positive price preference. The MACD projected near-term bullish push post encountering a bullish crossover. Directional Movement Index sided the bulls showing strength in LINK’s northbound price trajectory. If the bulls fizzle out along with the number of buyers, LINK would immediately fall to trade at the $19.83 price level.


