Disclaimer: The findings of the following analysis are the sole opinions of the writer and should not be considered investment advice.
Grand promises on the left but an amateur hour on the right, this is a usual complaint most ADA holders have been having for over eight months now. It should be noted here that Cardano’s culture of over-promising and under-delivering speaks volumes for its price action.
In September 2021, ADA’s valuation looked totally divorced from its fundamentals. Even though the token achieved an all-time high, the project was much in its infancy. Despite the development narrative dominating the Cardano market, the token hasn’t been able to live up to its investors’ expectations.
It seems Cardano’s NFT projects have also been failing to aid its price action. Reportedly, 4.7 million native tokens have been issued on the Cardano network. In fact, 937 projects are being built on Cardano while the total number of NFT projects increased to 5,549. However, at the time of writing, ADA was trading at $0.5366, down by about 6.90% over the last seven days.
Probing price
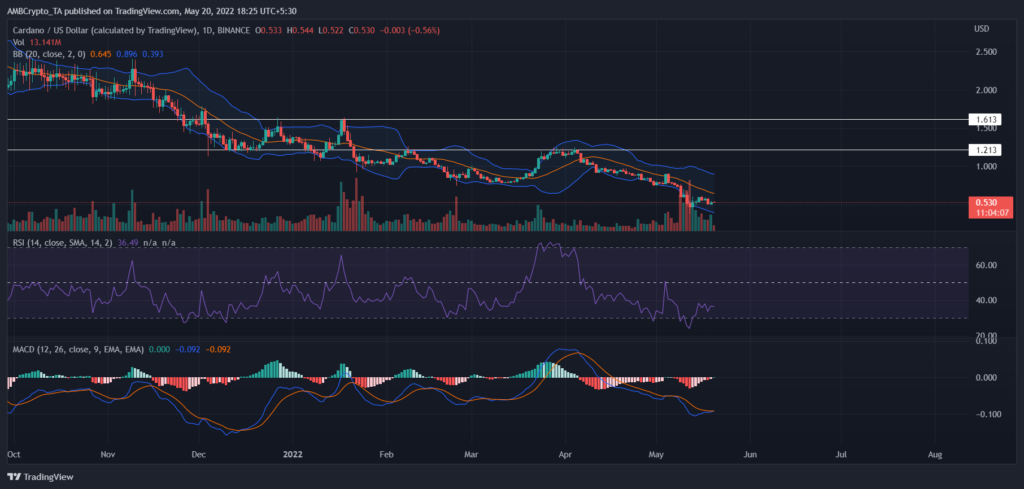
Following the UST crash’s ripple effect, ADA went to a low of $0.39- a level last seen in February 2021. Consequently, the token saw one of the biggest capitulation events. However, after 12 May, the bulls have been exerting pressure but the unimpressive volume might not see ADA cross its month-long resistance at $1.21. However, in case, if demand kicks in for a sustained period, ADA might see a rally to $1.613.
The indicators, at the moment, don’t seem to support any bullish thesis. RSI stood at the 36.58 mark for its latest session, not hinting at any trend reversal. Moreover, the price appeared to be on the lower side of the Bollinger Bands while the width of the band looked poised for a volatility run ahead. MACD line, on the other hand, looked north. But the expectation of a bull run will be a relief only to a fool’s mind.
What should a trader do then?
In order to earn an adequate profit, it’s very important to cut losses during the market crash. For ADA investors’ the exit point has been a million-dollar guess. Well, the entry and exit points might differ for every trader. The risk appetite, capital size, and trading system should be taken into consideration before deciding to open any position.
But looking at the metrics can give you an edge. While the broader market sentiment has been humming a bearish tune, it’s imperative to take a look at the social dominance of ADA. On 21 April, the metric saw a huge spike in the last six months only to decline and rest at the 0.769 mark, at the time of this analysis.
A look at the price chart on 21 April doesn’t show any significant changes. This clearly hints at the fact that hype alone can’t get the project to go up in its valuation. And, the metric could be misleading if a trader were to open his long position that day.
On the other hand, the MVRV (30-Day) reading clearly showed that the token was undervalued at the time of writing. This somewhat hinted that a further crash in ADA’s price could be a possibility in the coming week. The recent bearish price marks might also be a very good opportunity for traders who have been looking to open a short position.
Another tense metric appears to be ADA’s volume. This has been falling down since 12 May. Unless the volume recovers, investors will not be able to see a rally. It should also be noted that only headstrong traders have been able to cruise through the current bear market with ADA in their portfolio.
Keeping pessimism aside, the development activity for ADA can be seen looking northwards after a fall on 15 May. But, the price action hasn’t been complementing the metric. For long-term investors, this might make sense. But for swing traders, it might be a confusing signal to enter the ADA market.
Now, allocating a major part of your portfolio to ADA might feel like putting your hand in the fire. Therefore, traders/investors can take a call based on their risk appetite.


