The cryptocurrency market had displayed a period of dynamic trading. Bitcoin lost over 7% in the last week, although the coin recovered minorly at the time of writing. Other coins have dipped on their charts following major altcoins and their bearish price action.
Certain altcoins, however, swam against the tide and registered major gains over the past day. Chainlink and Uniswap have gathered over 7% gains within the same time frame. At press time, LINK was priced at $22.60, and UNI was exchanging hands at $18.99.
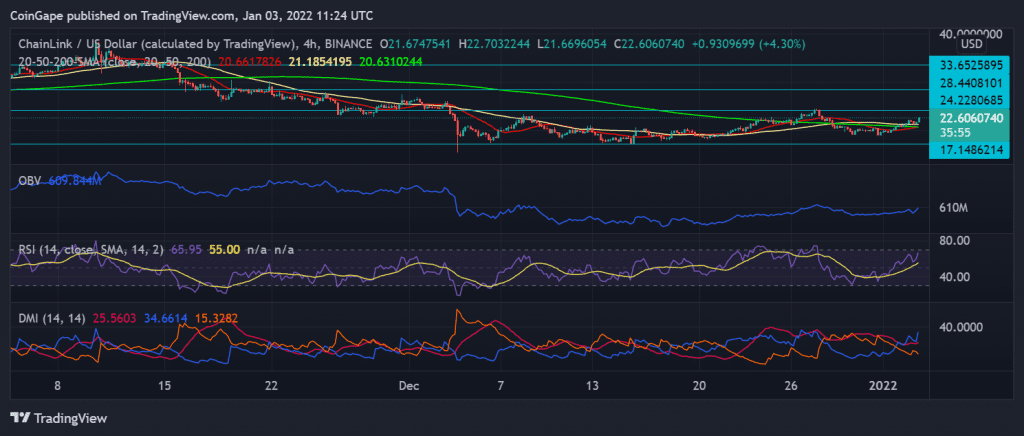
Chainlink/USD Four Hour Chart
Chainlink found support above the $17.14 price level, and the coin was trading close to its immediate resistance of $24.22. The altcoin had attempted to trade above the $24.22 level. However, the coin did not manage to trade above that level.
The other resistance level stood at$28.44 and $33.65. Indicators have remained positive, reflecting the change which LINK encountered 24 hours ago. The LINK price was seen above the 20-SMA, indicating bullishness on charts.
The Relative Strength Index displayed overbought conditions twice in a week. This signaled an increased number of buyers in the market. A continued push from buyers could help LINK trade above the $24.22 level, which the coin hasn’t gone over throughout December.
On Balance Volume also pointed towards an increased buying volume in the market. The Directional Movement Index indicated strength in the market, +DI was above the -DI line, and the ADX portrayed strength in the market trend.
UNI/USD Four Hour Chart
Uniswap invalidated its bearish thesis, which the coin struggled to reverse for most of December. Immediate resistance for the coin was at $19.06, moving above which the coin could attempt to trade near the $20.36 price level. Over the last 24 hours, the coin surged 9.3% and was trading for $18.99.
The support line for the coin stood at $17.03, and the other price floor stood at $15.18. On the four-hour chart, the price of UNI was above the 20-SMA as buyers dictated the price momentum of the market.
The Relative Strength Index shot above the half-line and was eyeing the overbought zone as there were many buyers in the market.
On Balance Volume was also on the side of the bulls, the indicator spiked sharply, the reading meant buying strength took over selling pressure in the market.


