Disclaimer: The findings of the following analysis are the sole opinions of the writer and should not be considered investment advice
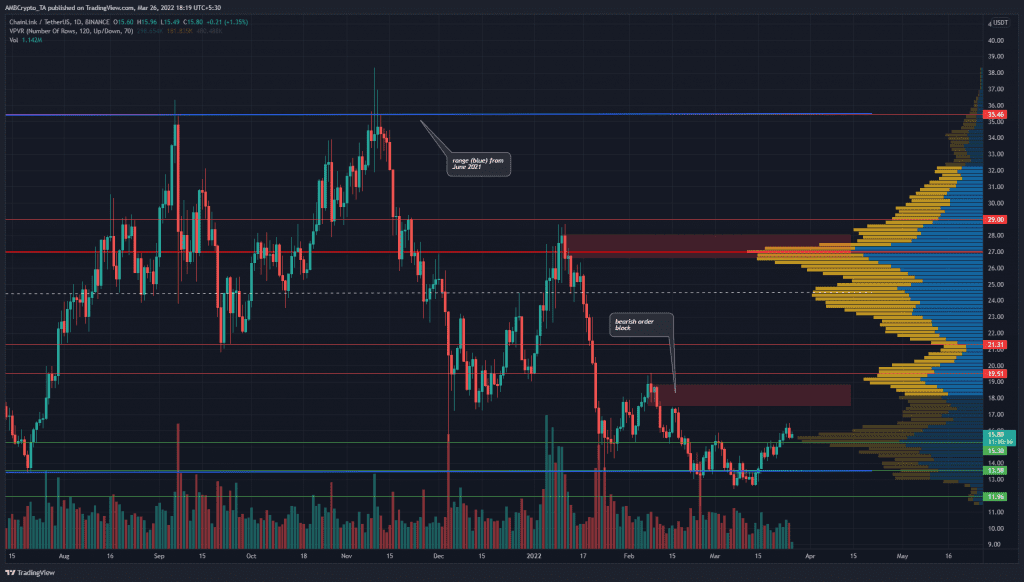
Chainlink has been trading within a range from June 2021. In the past month, the price has dipped beneath these lows, but demand was sufficient to push it back higher. In other news, Chainlink became part of the Lemonade Crypto Climate Coalition. This will make the platform available to the Coalition in an effort to provide weather insurance to subsistence farmers.
LINK- 1D
The price climbed past the $15.3 level of former resistance and could retest it as support. In all likelihood, this would be followed by a run higher for LINK- the $18 area (red box) represents a bearish order block, which means it is likely that selling pressure would be strong here. This could be used by large market participants to trap long positions.
On the other hand, the $18-$19.5 area also represents the Value Area Lows on the Volume Profile Visible Range tool. Hence, a move to this area would also be a bullish development.
Which one would it be? A bull trap or confirmation of an uptrend? A lot would depend on Bitcoin as well, but if demand was seen alongside a move to and past $18 in the weeks to come, it would be confirmation of an uptrend.
Rationale
Where would we see this demand? One reliable yet simple tool is the OBV. As things stand, the OBV did not signal a bullish reversal in sight. It did show that March saw slightly more buying volume than selling, but not by a wide margin.
The RSI climbed above neutral 50 once more and showed that the daily timeframe has a bullish bias once again. The DMI did not show a significant trend in progress yet, as the ADX (yellow) was beneath 20.
Conclusion
Chainlink has a bullish outlook to it in the weeks to come. The price is always attracted to liquidity, and now that $15.3 has been broken, it could be retested as support before the next leg higher toward the $18 area and the $19.5 level.


