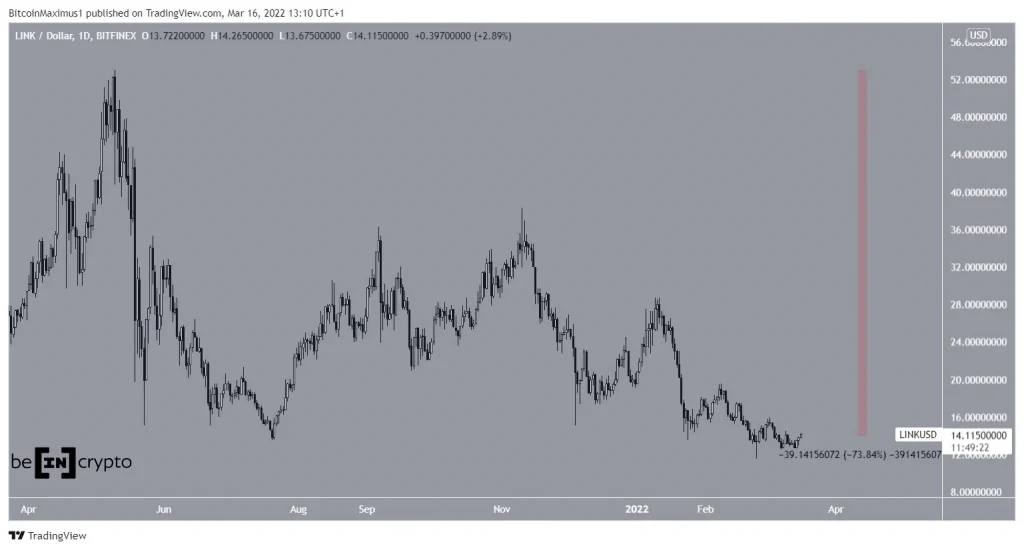
Chainlink (LINK) is showing signs of a potential bullish reversal.
LINK has been falling since reaching an all-time high price of $53 on May 10 2021. Initially, the price bounced and consolidated above $25 for a period of nearly six months.
However, the downward movement resumed on Jan 21, leading to a low of $11.43 on Feb 24. While the price has bounced since it has yet to initiate a significant reversal.
Measuring from the all-time high, LINK has decreased by 74%.
Future movement
Cryptocurrency trader @CryptoCapo_ tweeted a chart of LINK which shows the bearish pattern prior to the current drop.
Since Nov 10, LINK has been trading inside a descending wedge. The descending wedge is considered a bullish pattern, suggesting that a breakout would be the most likely scenario.
More importantly, both the RSI and MACD have generated bullish divergences (green lines). Such pronounced divergences very often precede bullish trend reversals. Therefore, it is possible that LINK will undergo such a reversal.
If a breakout occurs, the closest resistance area would be at $28. This is a horizontal resistance area and the 0.618 fib retracement resistance level.
Wave count analysis
It is possible that the entire LINK downward movement since the May all-time high is part of an A-B-C corrective structure (black). If so, the price is currently in wave C.
In the structure, waves A:C have had a nearly 1:0.618 ratio, the second most common in such structures, after the 1:1 ratio.
Wave C has taken the shape of an ending diagonal, which is often followed by a swift reversal.
A breakout from the descending wedge would confirm the count and indicate that the long-term bottom is in.
For BeInCrypto’s latest Bitcoin (BTC) analysis, click here
Disclaimer
All the information contained on our website is published in good faith and for general information purposes only. Any action the reader takes upon the information found on our website is strictly at their own risk.


