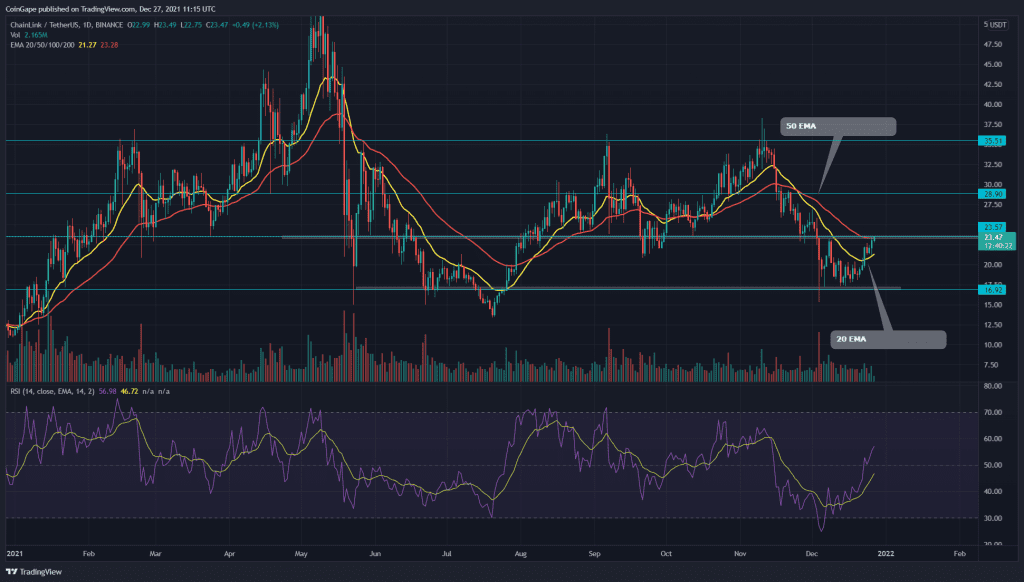
After a significant correction phase, the Chainlink token managed to obtain strong support from the $17 mark. The token price started recovering where it is currently facing a crucial resistance of $23.5. With the increasing bullish momentum, the pair has reasonable possibilities to breach this overhead resistance and continue its rally.
Chainlink Key technical points:
- The LINK price flips the 20-day dynamic resistance into a possible support
- The daily RSI line charging towards the overbought zone
- The 24-hour trading volume in the Chainlink token is $1.09 Billion, indicating a 29.96% gain.
Source-Tradingview
The retracement phase in the Chainlink token dropped the price to the strong support of $17. The pair was discounted by $51% while looking for sufficient demand pressure from the bottom support. The token price spent more than a week hovering above this level, displaying several lower price rejection candles.
On December 23rd, the token indicated a long bullish green candle, initiating a bullish reversal in the price. The current price of the token is $23.58, with an intraday gain of 2.66%
The LINK token is still trading below the trend defining 100 and 200 EMA, indicating a bearish trend in the price. However, the recent bullish reversal has recently crossed above the strong resistance of 20 EMA into a possible support level.
The daily Relative Strength Index (61) shows a striking recovery from the oversold zone. Moreover, the line is moving above the 14-EMA and has recently reclaimed the middle-neutral level(50).
LINK/USD 4-hour time frame chart
Source- Tradingview
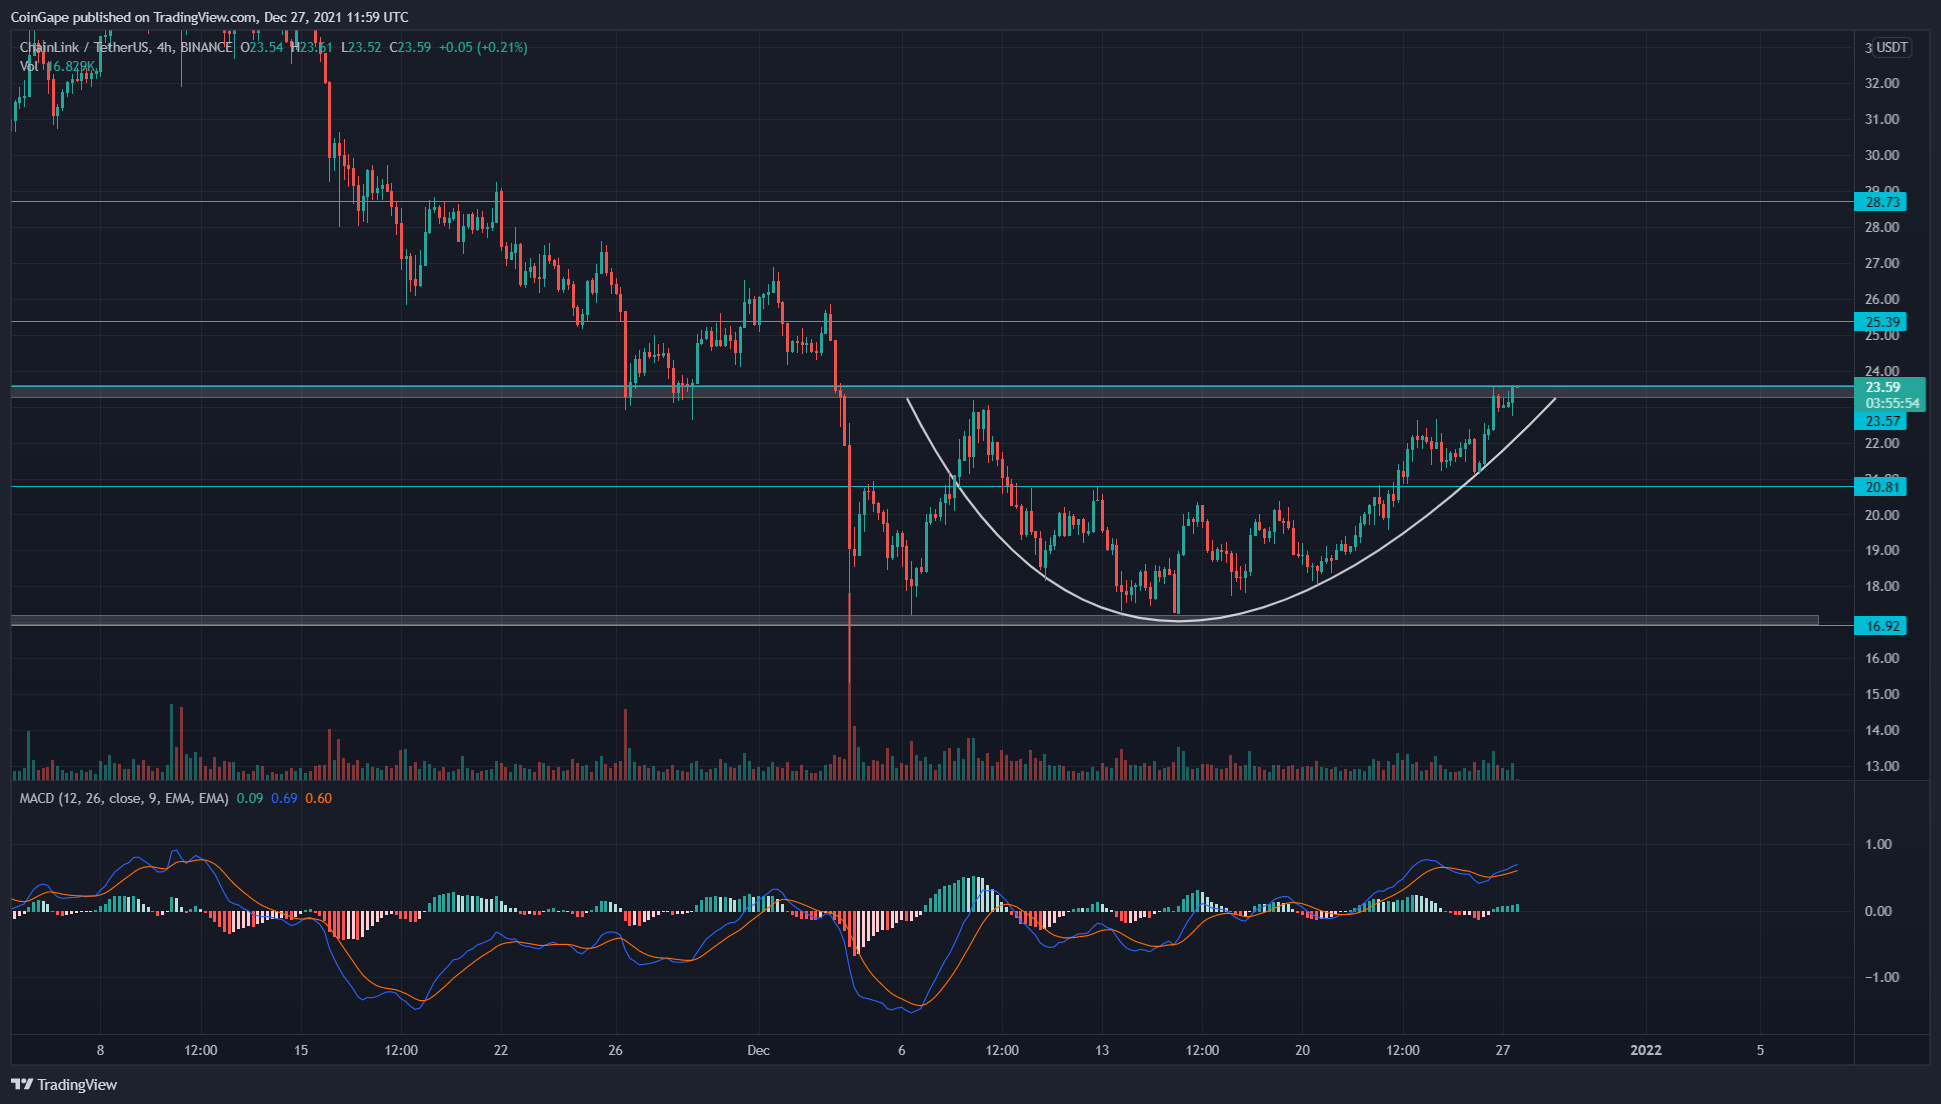
The bullish reversal in the LINK token has formed a cup and handle pattern in this lower time frame chart. The price is currently at the doorstep of this pattern neckline, i.e., $23.5, preparing for a bullish breakout. So far, the token has surged 37.5% from the bottom support level.
The Moving average convergence divergence indicator shows a bullish crossover among the MACD and signal lines, indicating the increasing bullish momentum.


