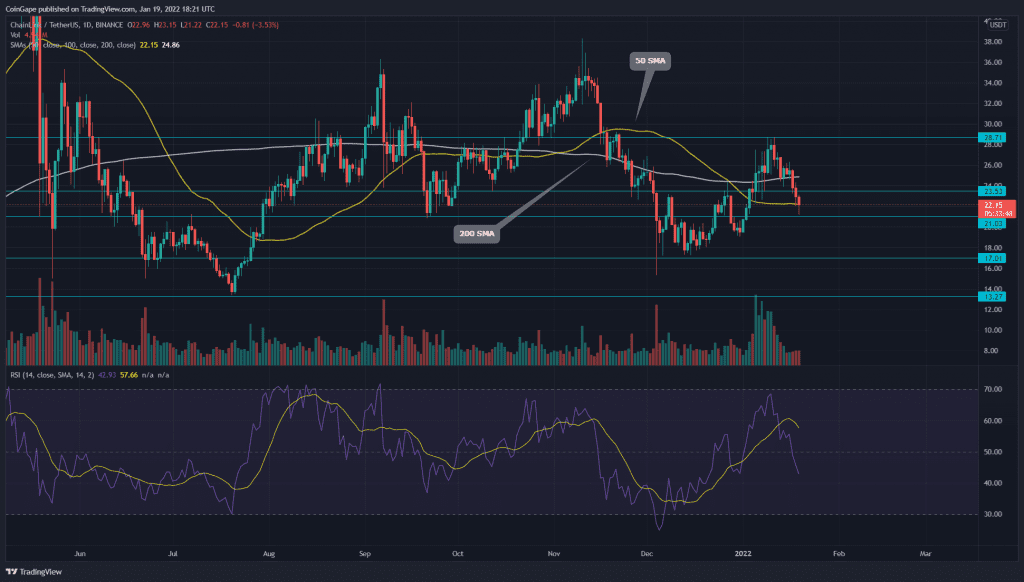
The technical chart indicates the overall trend for Chainlink tokens is still sideways. The token price was recently rejected from the $28.7 resistance, which initiated a minor pullback. The price is currently hovering above the $21.1 support, looking for enough demand pressure.
Key technical points:
- The 4-hour-MACD indicator shows its lines are on the verge of crossing below the midline
- The intraday trading volume in the LINK token is $1.07 Billion, indicating a 9.6% fall.
Source- Tradingview
In our previous coverage of Chainlink technical analysis, the token price was riding a recovery rally during the first half of January. The price made it to the $28.7 mark, where the intense selling pressure immediately rejected the price by forming an evening star candle pattern.
The LINK/USD pair started to drop again and breached the $23.5 support level. The price is currently trading at the $22.03 mark, indicating a 26.5% loss from the last swing high(28.7).
The Longer SMA lines 100 and 200 have fallen due to the sideways trend in LINK token price. However, the token price is currently trading below 200 SMA, projecting a bearish trend. However, the 50 SMA is still trying to sustain the bullish rally.
The daily-Relative Strength index(43) slope has recently slipped below the midline and 15-SMA line.
Will LINK Token Bulls Lose The $20 Mark Again?

Source-Tradingview
The V-Top bearish reversal in the LINK token price has retested $21 support. The crypto traders looking for new entry opportunities should closely observe the price action at this support for reversal signs.
However, on the contrary now, if the token price violates the $21 support level, the retracement phase will continue, and the price will fall to tower support levels($17).
The Moving average convergence divergence shares the MACD and signal line are on verge of dropping below the neutral zone, indicating bearish momentum. Moreover, the rising red on the histogram chart confirms the strong selling in this token.
- Resistance levels- $23.5, $28.7
- Support levels are $21and $15.


