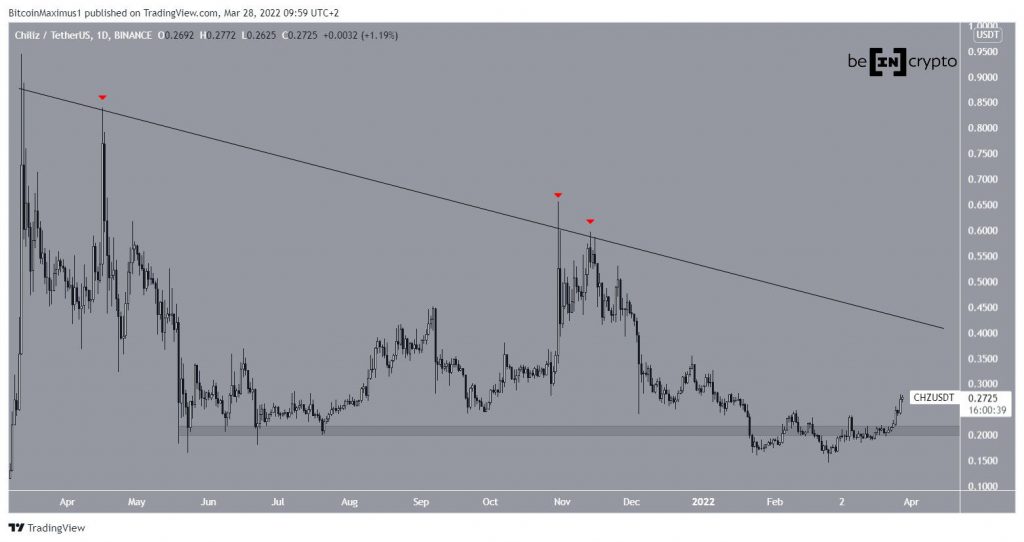
Chiliz (CHZ) has increased by 94% since its Feb 24 lows. A breakout from the current short-term pattern could further accelerate its rate of increase.
CHZ has been decreasing underneath a descending resistance line since reaching an all-time high price of $0.944 on March 12 2021. The line has caused three rejections so far, the most recent one on Nov 13.
Afterward, CHZ resumed its descent, falling to a low of $0.144 on Feb 24. The price has been moving upwards since.
During the increase, CHZ reclaimed the $0.21 horizontal area, which is now expected to provide support. If the upward movement continues, the aforementioned descending resistance line would be at $0.41.
CHZ breaks out
The daily chart supports the continuation of the upward movement at least to this resistance line.
It shows that prior to the reclaim of the $0.21 area, CHZ broke out from a descending resistance line (dashed) and validated it as support afterward (green icon).
In addition to this, the upward movement was preceded by bullish divergence in both the RSI and MACD (green lines). Such divergences often precede significant bullish trend reversals.
Furthermore, the MACD is now positive and the RSI has moved above 70, both of which are considered signs of bullish trends.
The two-hour chart shows that since the upward movement began on Feb 24, CHZ has been trading inside an ascending parallel channel. Channels are considered corrective movements and the price is currently trading at the resistance line of this one.
Therefore, a breakout from it could greatly accelerate the rate of increase and would confirm that a bullish reversal has begun.
Wave count analysis
Cryptocurrency trader @TheTradingHubb tweeted a chart of CHZ, showing that it is possible that the price will create a flat corrective structure.
The wave count suggests that CHZ has completed an A-B-C corrective structure (white) when measuring from the all-time high. Waves A:C had a 1:0.618 ratio (white), which is common in such structures.
The fact that the entire movement is contained inside a long-term descending parallel channel further supports this possibility.
The sub-wave count is given in black
Going back to the aforementioned short-term channel, a breakout from it and its subsequent validation as support would confirm that the upward movement has begun.
For BeInCrypto’s previous Bitcoin (BTC) analysis, click here
Disclaimer
All the information contained on our website is published in good faith and for general information purposes only. Any action the reader takes upon the information found on our website is strictly at their own risk.


