Recent weeks have seen a dramatic increase in social mentions of Chiliz, data compiled by LunarCrush show. Its token’s 90-day high made it big in the latest social mentions.
Market insights tracker LunarCrush cited this figure (9.46k) as one indicator to keep an eye on when considering an investment in Chiliz.
The approaching 2022 FIFA World Cup may help explain the increase in social media buzz. This is due to the fact that the CHZ token has a practical application in the realm of sports.
Will the increase in social media references lead to an upswing with less than a month until the start of the much-hyped global sports spectacle?
If you are looking for interesting projects to invest in, watch out for social activity eruptions, especially before price.
E.g Keep a close eye on #chiliz. $chz social mentions measured daily hit 9.46K, the highest point in the last 90 days!
Insights: https://t.co/S4Hd87jv4R pic.twitter.com/wLXeapUueD
— LunarCrush (@LunarCrush) October 12, 2022
Chiliz Jargon And All The Talk
Data provided by CryptoQuant shows that CHZ’s foreign exchange reserves have decreased by 0.72% over the last seven days.
The fact that investors appear to be buying CHZ with the intention of keeping it for the long term is a very optimistic indicator.
The high number of persons depositing to exchanges , which can be observed with the exchange depositing transactions tool, more than makes up for this.
Chart: TradingView
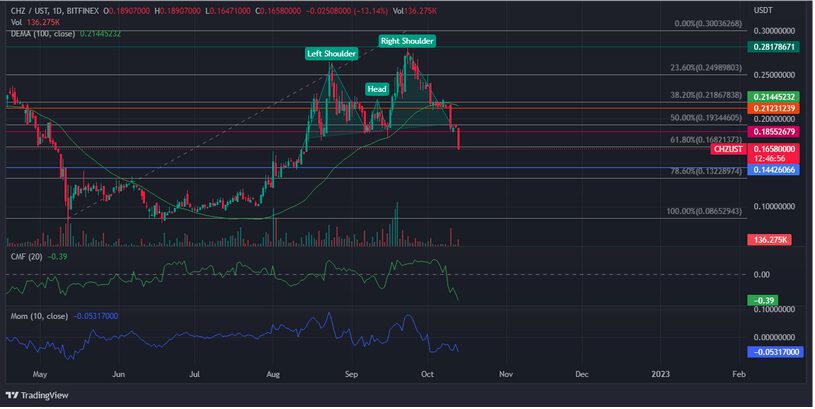
Previous and current price movements exhibit a head-and-shoulders harmonic pattern, which typically occurs just prior to a trend reversal. In both intraday and 4-hour periods, the coin is currently experiencing a significant free fall.
Chaikin’s money flow indicator likewise deteriorates, falling to -0.34 as well. A sign that bears are dominant in the current time frame. The bull-bear strength signal is negative, and bears are currently attacking the market.
With the present speed of the wild decline, a trading day close below the 61.80 Fibonacci level is anticipated.
Can CHZ Still Spice Up The Situation?
CHZ is presently in one of the worst possible situations for a cryptocurrency. With the $0.28 resistance displaying strength and the $0.18 support line having been breached, a decline towards the key $0.14 level is expected.
However, if the 61.80 Fibonacci level mitigates the present slump, the $0.18 or $0.21 immediate resistance levels could be tested or broken. Things don’t seem to look good for the bulls at this moment.
Long-term investors are in trouble as this decline has broken the ascending triangle pattern. The 20-day to 100-day DEMA all support this tendency. As the FIFA World Cup approaches, a trend shift may occur during the next few weeks.
CHZ market cap at $1.16 billion on the daily chart | Featured image from The Coin Republic, Chart: TradingView.com
Disclaimer: The analysis represents the author's personal views and should not be construed as investment advice.


