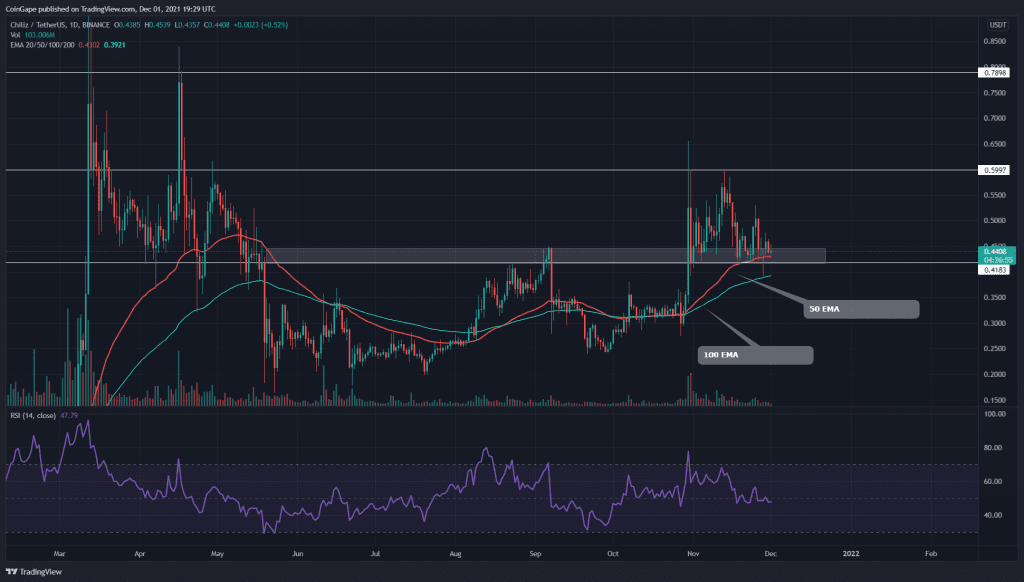
The CHZ token maintains a bullish trend in its technical chart. The coin price is currently stuck in a correction phase, and the price is still wavering above the $0.43 support. Furthermore, the coin presents descending triangle pattern, whose breakout should give a directional move in the chart.;
Key technical points:
- The CHZ shows a cup and handle pattern in the daily time France chart
- The CHZ price resonates in a descending triangle pattern of the 4-hour time frame pattern
- The intraday trading volume in the CHZ token is $278.5 Million, indicating a 3.2.5% hike.
Source- CHZ/USD chart by Tradingview
On October 30th, the CHZ token indicated an excellent opportunity for the crypto traders when the price breached a crucial resistance of $0.44-$0.42. This new rally was rejected from the $0.6 mark, and the price entered into a minor retracement phase.
The coin price plunged to the $0.43 mark to check for sufficient support from this level. Moreover, the technical chart also reveals a cup and handle pattern, with the neckline at the $0.6 mark.
The crucial EMA’s(20, 50, 100, and 200) states an uptrend for this token, as its price trades above all these EMA lines. The Relative Strength Index(47) presents a bearish sentiment within the price.
CHZ/USD 4-hour Time Frame Chart

,
Source- CHZ/USD chart by Tradingview
The CHZ token shows a descending triangle pattern in the 4-hour time frame chart. The neckline for this pattern is at $0.42, holding this great short opportunity for crypto traders. However, even though this is a bearish pattern, the daily chart suggested this pattern is a part of a retracement phase.
Therefore, these traders should wait for the price to breach the neckline or overhead resistance trendline to confirm which way the rally wants to continue.


