BeInCrypto takes a look at the price movement for seven different cryptocurrencies, including Cosmos (ATOM), which might have completed its short-term correction.
BTC
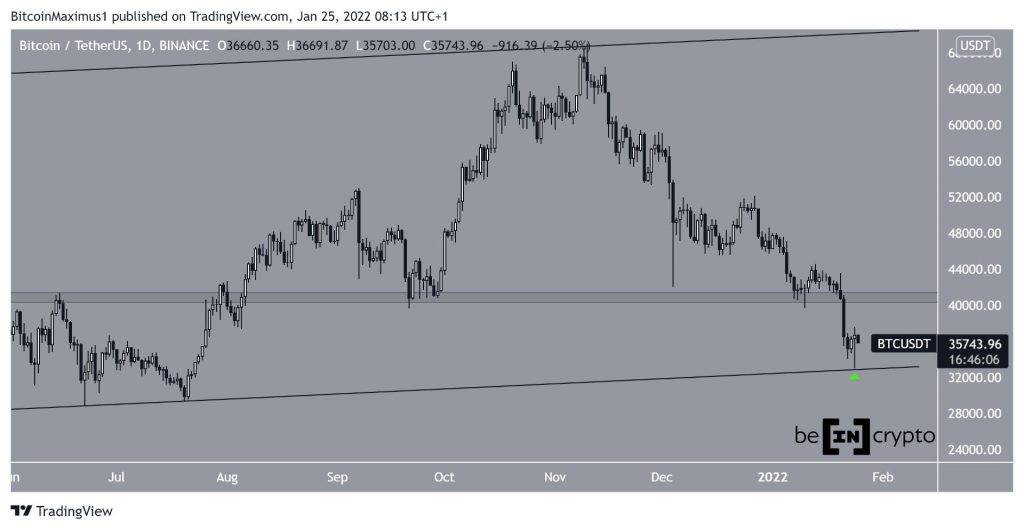
BTC has been falling since reaching an all-time high price of $69,000 on Nov 10. The downward movement continued until Jan 24, when BTC reached a low of $32,917.
However, it bounced immediately afterwards, creating a long lower wick in the process. The bounce also served to validate the support line of an ascending parallel channel (green icon), which has been in place since April.
If the upward movement continues, the $40,500 horizontal area would be expected to act as resistance once more.
ETH
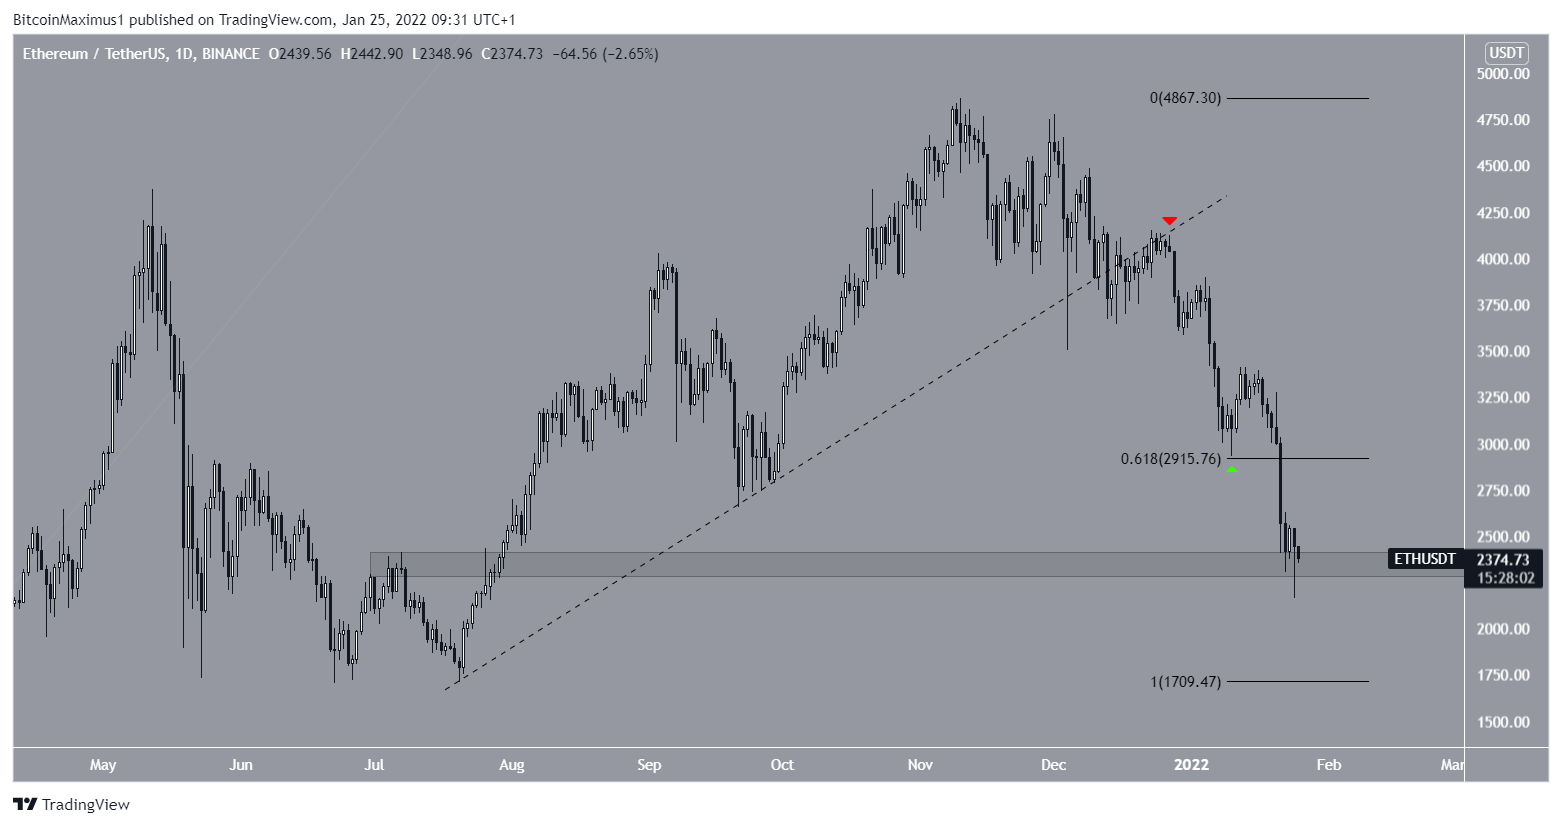
ETH has also been falling since reaching an all-time high price of $4,838 on Nov 10. The downward movement accelerated once the token broke down from an ascending support line and validated it as resistance on Dec 27.
While the token initially bounced at the 0.618 Fib retracement support level (green icon) on Jan 10, it eventually broke down.
Currently, it is trading just above the $2,400 horizontal support area.
Even though there are no bullish reversal signs in place, ETH is trading just above a crucial horizontal support area.
XRP
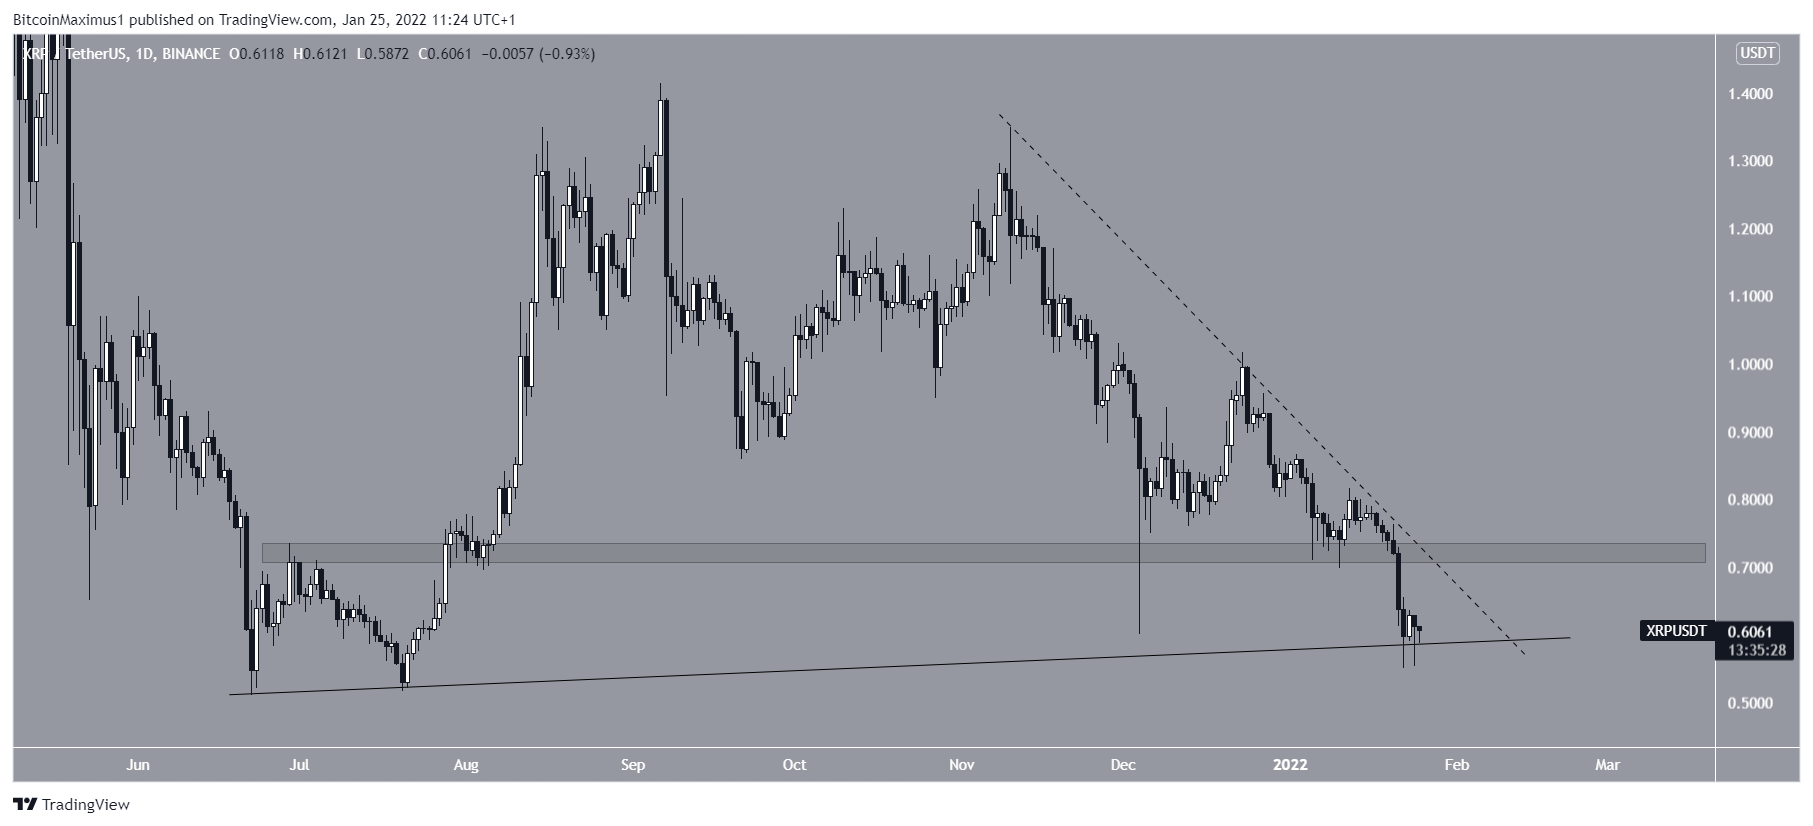
XRP has been falling alongside a descending resistance line since Nov 10. Initially, it bounced above the $0.72 horizontal support area. However, it broke down from it on Jan 21.
Despite the breakdown, XRP bounced above an ascending support line that has been in place since June. This is the third time it validated the line as support.
As long as it is trading above it, the possibility of a bounce remains valid.
FTT
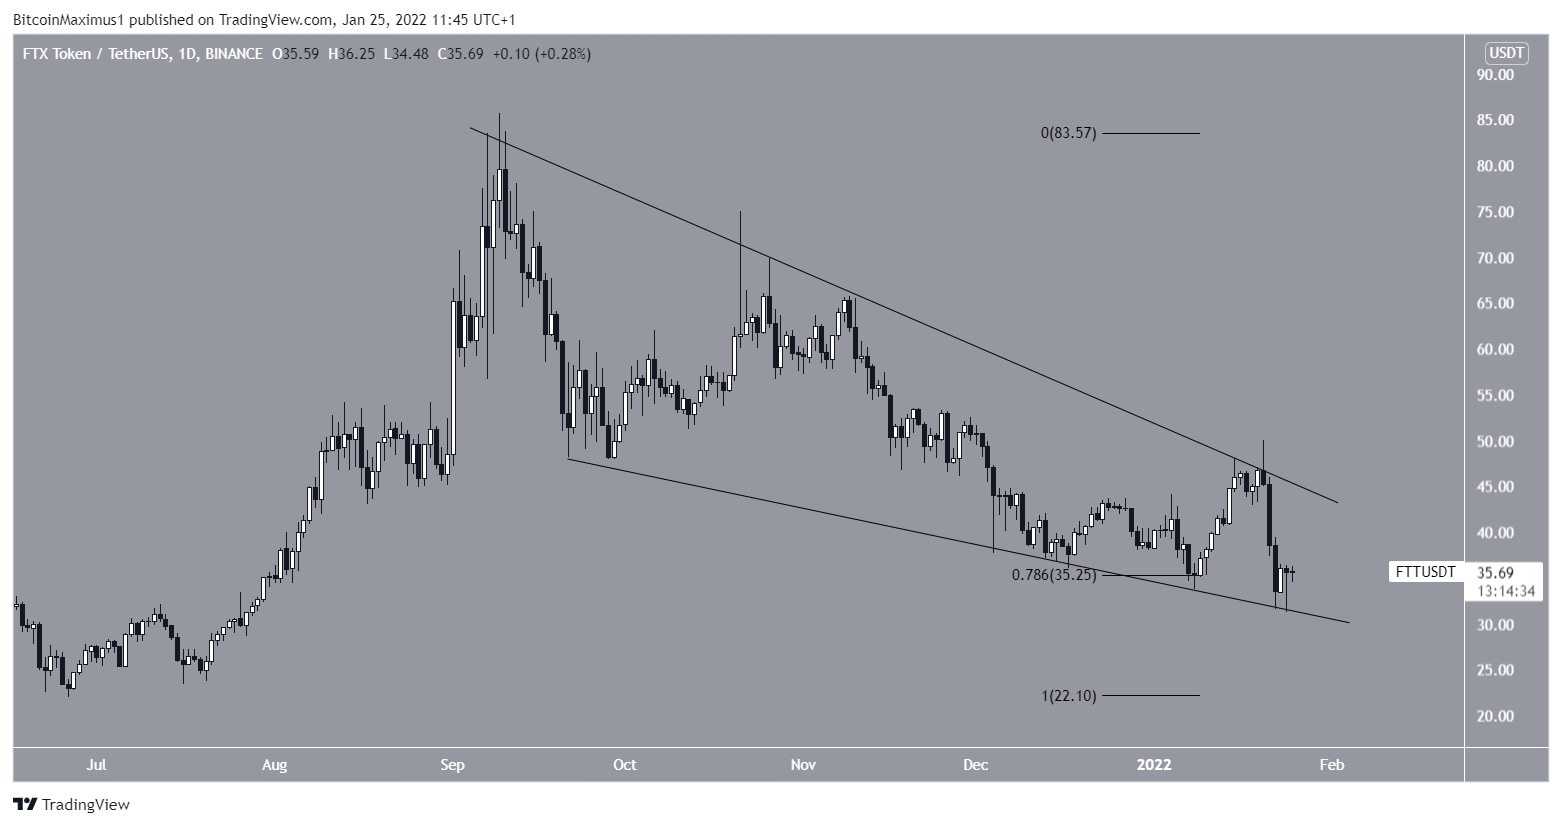
FTT has been decreasing alongside a descending resistance line since Sept 8. Furthermore, it seems that the token is trading inside a descending wedge, which is considered a bullish pattern.
On Jan 8 and 24, FTT bounced above the 0.786 Fib retracement support level at $35.25. While it fell below it the second time, it has reclaimed the support area since.
Such deviations are usually considered bullish developments. When combined with the fact that the descending wedge is considered a bullish pattern, a breakout remains the most likely scenario.
ATOM
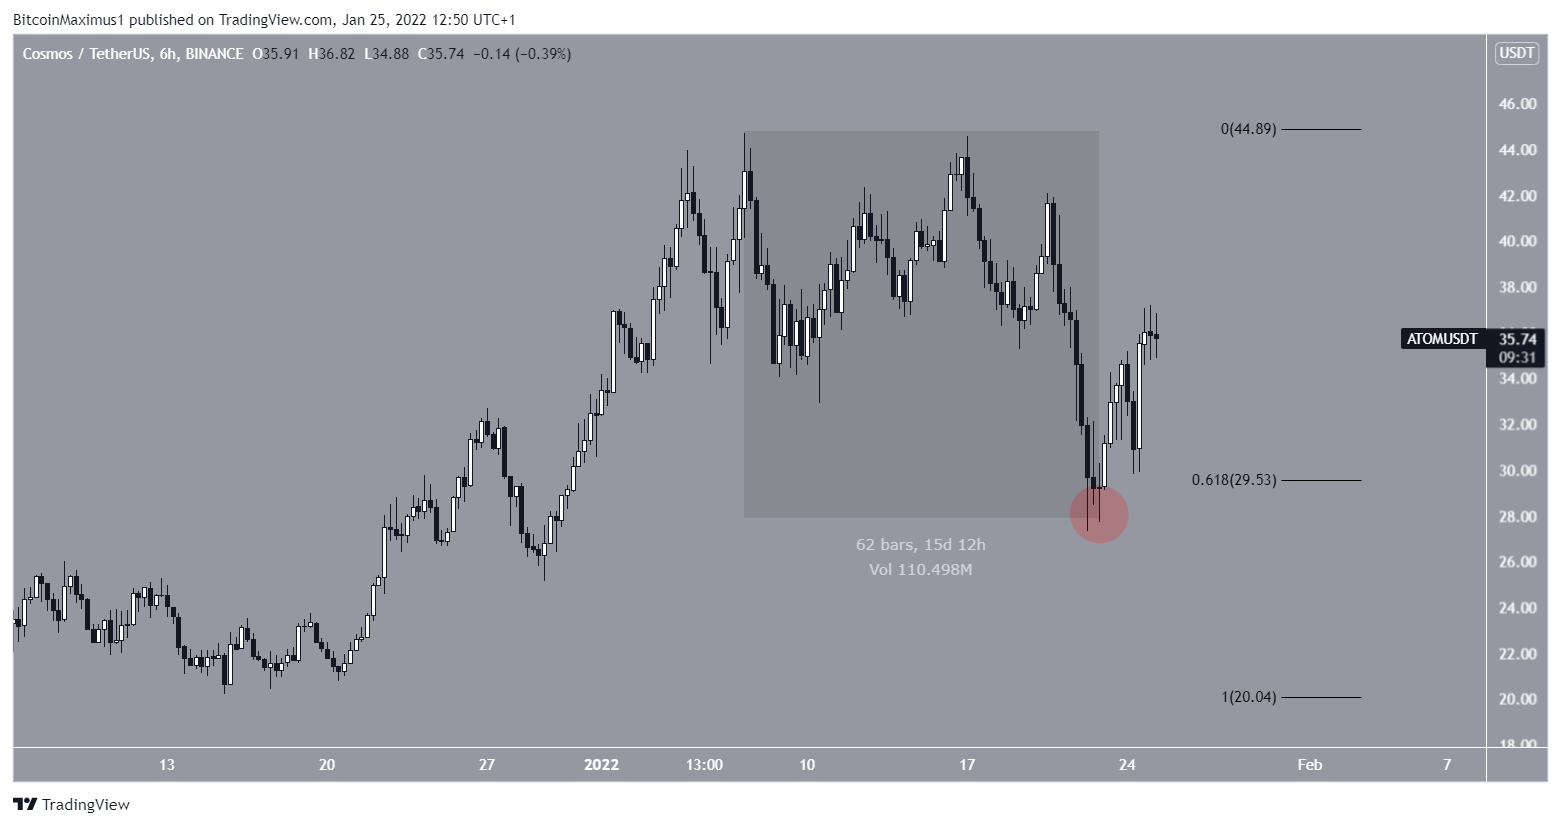
ATOM has been mired in a gradual decrease (highlighted) since Jan 7. On Jan 22, it reached a low of $27.31 and bounced (red circle). The bounce was important since it caused a reclaim of the 0.618 Fib retracement support level at $29.53.
Furthermore, the downward movement looks corrective due to the frequent overlap.
Therefore, it is possible that ATOM will continue increasing towards new highs.
BNB
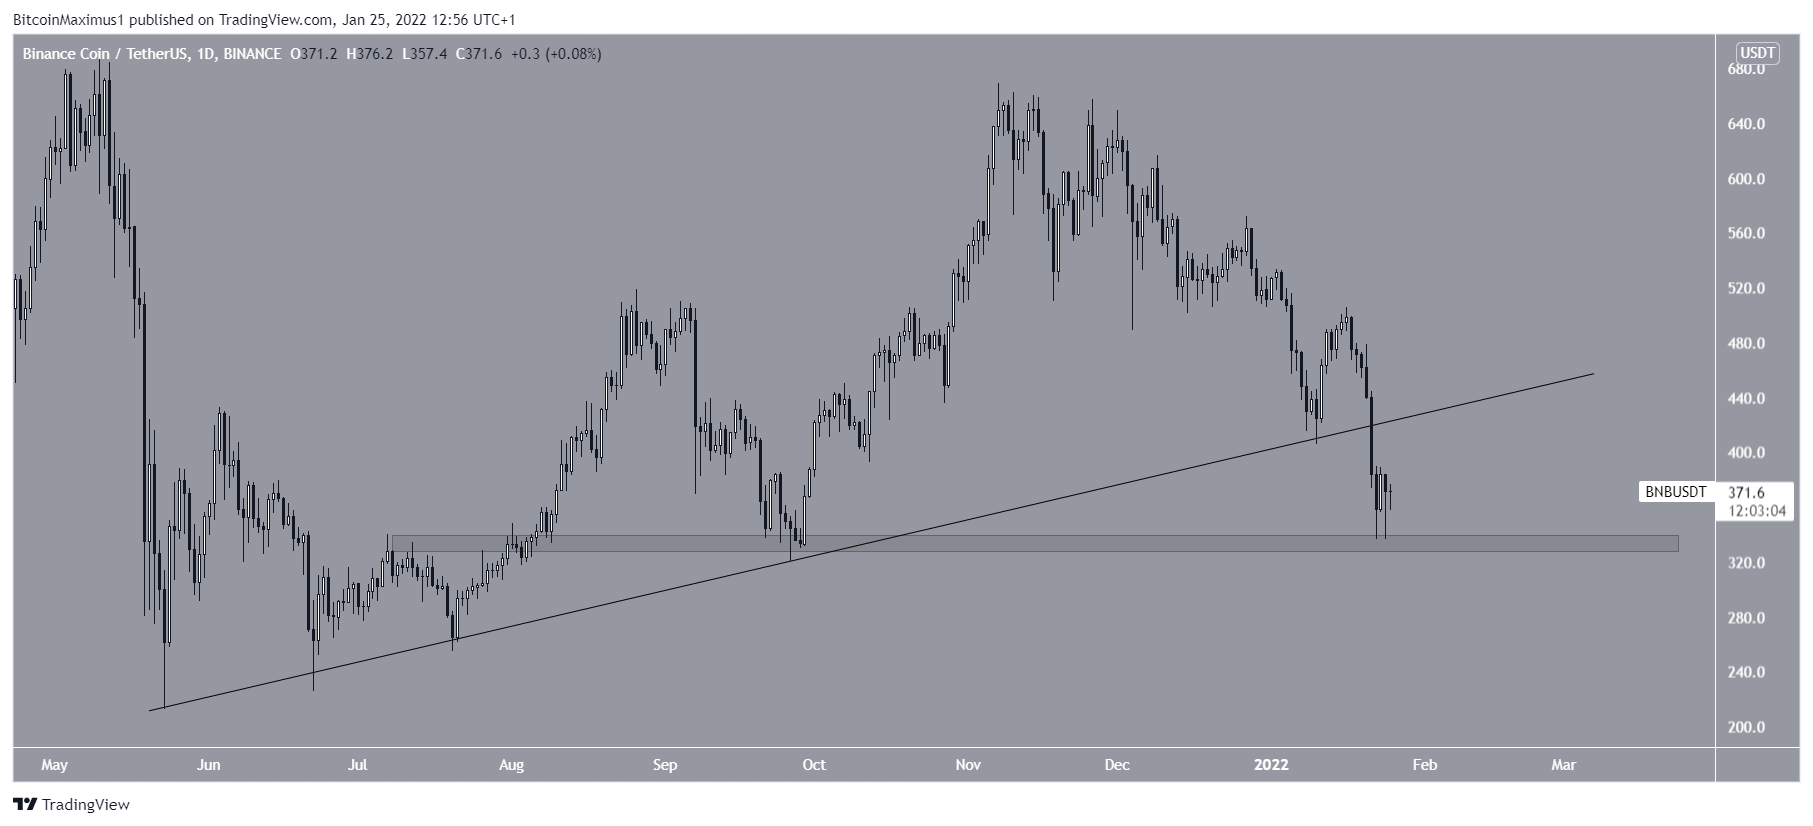
BNB had been increasing alongside an ascending support line since May. While following the line, it managed to reach a high of $669 on Nov 7.
However, it has been decreasing since and broke down from the support line on Jan 21.
The token bounced at the $325 horizontal level and could potentially validate the previous support line as resistance.
However, due to the breakdown, it is possible that the upward movement that began in May is complete.
IOTA
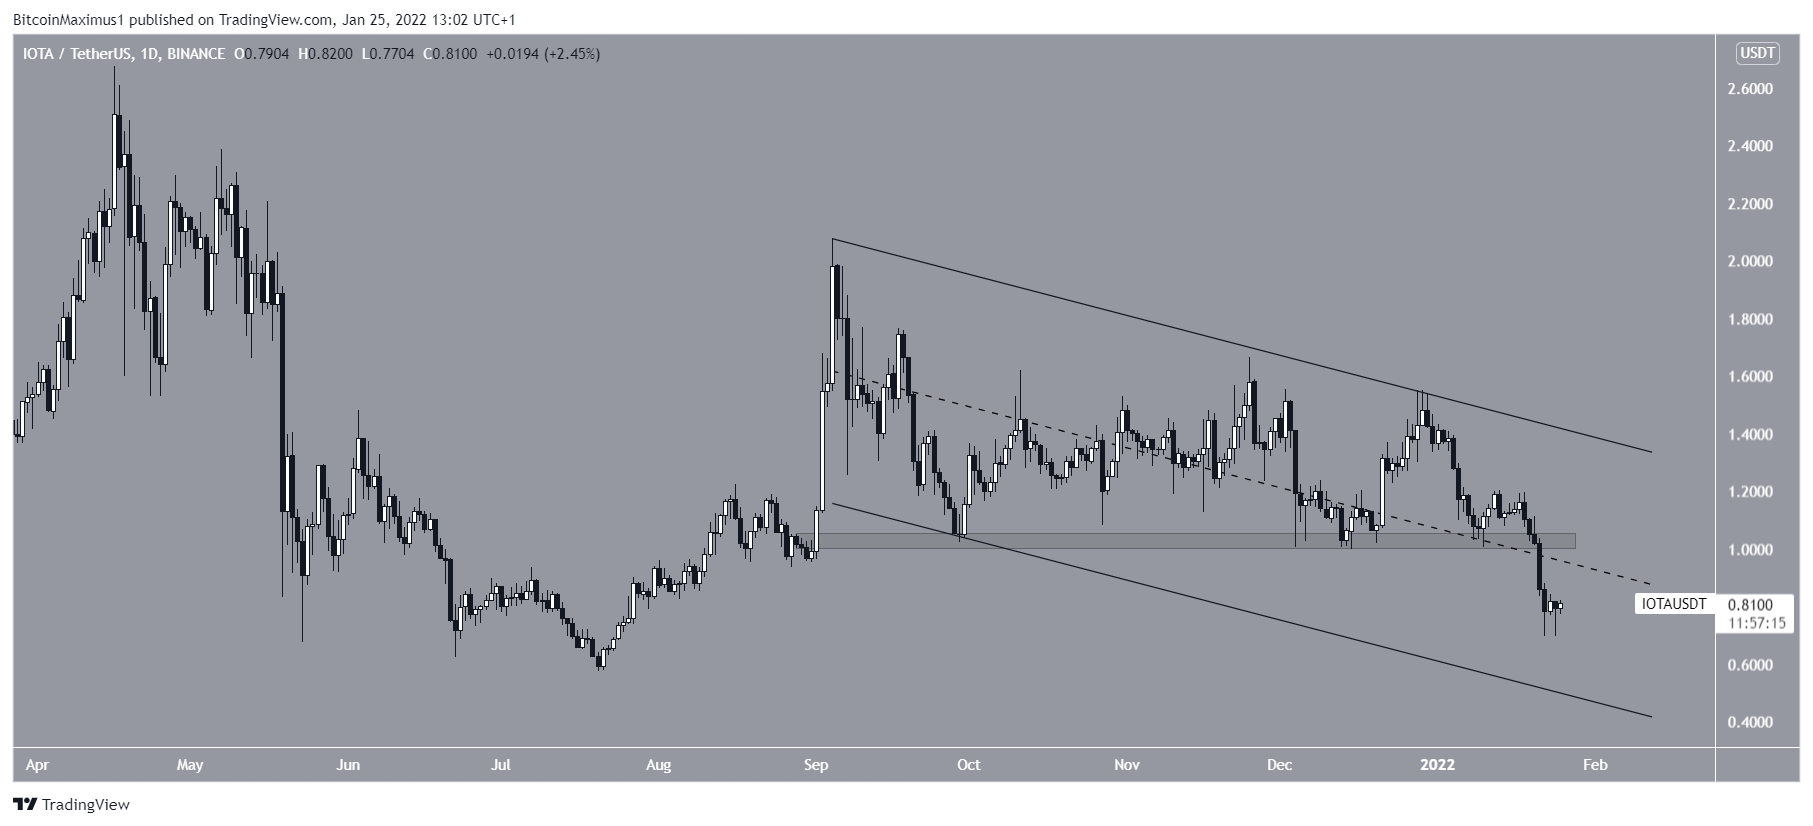
IOTA has been decreasing inside a descending parallel channel since Sept 4. Until Jan 17, it managed to hold on above the middle of the channel and the $1.05 horizontal support area.
However, it broke down afterwards and fell to a low of $0.69 on Jan 4.
While it has bounced since, it is possible that the token will decrease all the way to the support line of the channel at $0.60.
For BeInCrypto’s latest Bitcoin (BTC) analysis, click here.
Disclaimer
All the information contained on our website is published in good faith and for general information purposes only. Any action the reader takes upon the information found on our website is strictly at their own risk.

