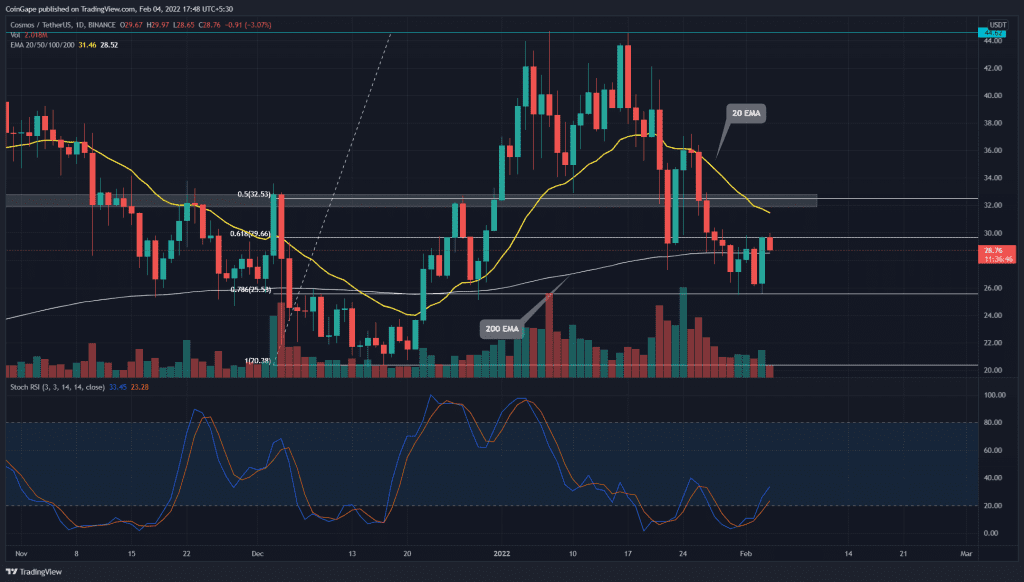
The ATOM/USDT pair registers a 13% gain from the $25.5 support in the last two days. The coin price rebounded with a long bullish candle, engulfed the last four days of trading activity. The buyers have managed to breach a descending trendline, which should kickstart a recovery rally
Key technical points:
- The ATOM price shows a bullish engulfing candle at $26 support
- The ATOM buyers regain the 200-day EMA
- The intraday trading volume in the ATOM coin is $1.16 Billion, indicating a 68.9% hike
Source- Tradingview
In our previous coverage on ATOM price analysis, we summed up the ongoing correction phase, which discounted the coin price by 42.5% from the All-Time High resistance of $44.6. The ATOM price plunged to shared support of horizontal chart level $25.5 and 0.786 Fibonacci retracement level.
For the past few days, the coin price has been hovering above the $25.5 support, looking for sufficient demand. On February 3rd, the buyers rebounded the coin with a bullish engulfing candle, suggesting the bulls are buying this dip.
The Stochastic RSI shows a decent rise over the past three days, steadily approaching the midline to confirm the bullish edge.
With the recent price jump, ATOM buyers reclaimed the 200 EMA line. The coin price sustaining this level will indicate the bullish trend is intact. However, a bearish crossover of the 20 and 100 encouraged the seller to continue this correction.
ATOM Buyers Escapes The Descending Trendline

Source- Tradingview
The 4-hour time frame chart shows the ATOM price has poked above the descending trendline, which has rejected the rallies since January 20th. Today the coin price shows a minor pullback to retest the flipped support trendline.
If the buyer could sustain above this trendline, the immediate target is located at $32.5. However, this overhead resistance is the key barrier, that the bull needs to knock out to confirm a recovery rally.
- Resistance levels- $30, and $32.5
- Support levels-$25.3 and $23.6


