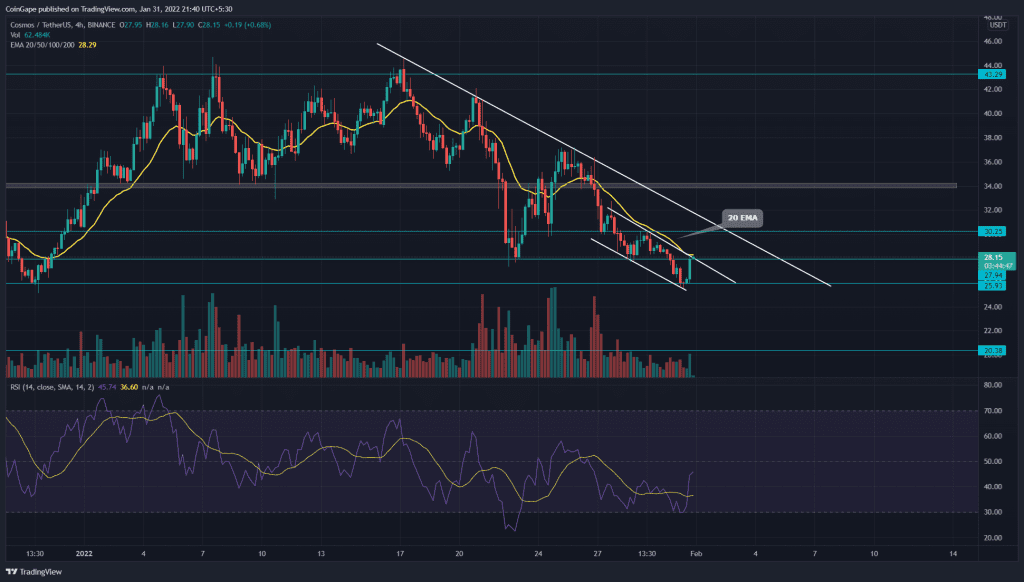
After the correction phase of more than 35%, the ATOM price finds demand near the $25 mark and jumps more than 7% in the past day. The price action forms a short falling channel, the breakout of which will result in a significant bullish jump.
Key technical points:
- The ATOM price struggles to rise above the 20-period EMA in the 4-hour chart.
- The intraday trading volume in the Cosmos coin is $837.4 Million, indicating a 10% gain.
Source- Tradingview
The ATOM price shows a downfall of more than 35% in the past two weeks, resulting in the formation of a resistance trendline. Furthermore, the price action creates a short-term falling channel with a recent bullish jump within the pattern.
- The recent jump of more than 7% in the coin price drives it higher to the short-term resistance trendline. The trendline tracks a similar path as the 20-period EMA in the 4-hour chart. Therefore, the breakout of the 20-period EMA will result in a price jump to the long-coming resistance trendline.
- The crucial EMAs(20, 50, 100, and 200) showcase a bearish alignment as the 100-period average falls below the 200-period average. Therefore, the breakout of these EMAs can provide buying opportunities.
- The RSI indicator shows a sharp increase in the slope as it breaks above the 14-day average and continues to approach the 50% line in the 4-hour chart.
The ATOM Price Gains Momentum Near $25

Source- Tradingview
The ATOM price finally forms a bullish candle in the daily chart with a significant lower price rejection near the $25 mark. However, the price is yet to break above the 200-day EMA until then the jump remains a retest of the fallout.
The important resistance levels for the ATOM are $31.5 and $37. As for the opposite side, the support levels are $25.5 and $22.
The Moving Average Convergence Divergence indicator reflects a solid underlying bearish trend in action. The MACD and signal lines maintain a downtrend as they break below the zero line.


