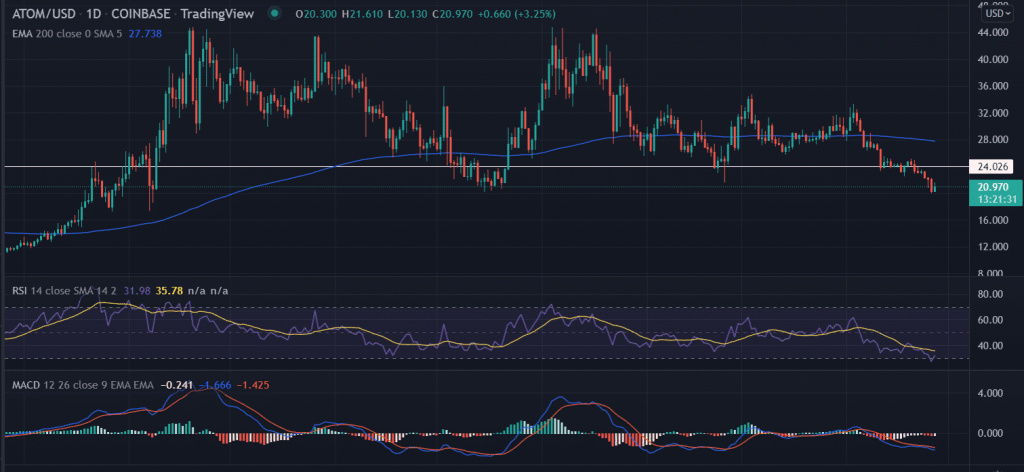
ATOM price is hovering near a crucial support zone. A technical bounce back is expected with an upswing of nearly 33%. Investors are looking for a relief rally in the token after a prolonged downfall in the price.
- ATOMprice manages to trade in green although struggles near $20.0.
- From the technical perspective, a jump toward $28.0 is on the cards as the formation of the bottoming pattern on the daily chart.
- However, a daily close below $20.0 will open the gates for further low levels.
ATOM price looks for upside sign
ATOM’s price surged 125% from the lows of $20.21 made in mid-December, to tag the swing highs of $44.80. However, this is a ‘Triple Top’ formation that resulted in a straight retracement to revisit the lows visited earlier near $20.0. A total of 56% descent was recorded during the fall in less than a month.
Currently, the ATOM price once again hovering near the reliable support placed at around $20.0. In addition to that, we expect a bullish formation, namely ‘inverted hammer’ with a condition of the next green candlestick on the daily chart above $22.0.
If that happens, the investors would next to keep eye on the horizontal resistance zone near $24.0. Further, a bounce-back toward $28.0 cannot be ruled out. A total of 33% upswing in the price is what investors looking for from the current levels.
On the contrary, a fall below the session’s low would wash out the bulls’ hope of any gains. A downside target could be located near the lows visible in early September around $17.0.
Trending Stories
As of press time, ATOM/USD holds at $20.95, up3.20% for the day.
Technical indicators:
RSI: The relative strength index remains in the oversold zone indicating a snapback in the price.
MACD: The moving average convergence divergence hovers below the midline with a neutral bias.


