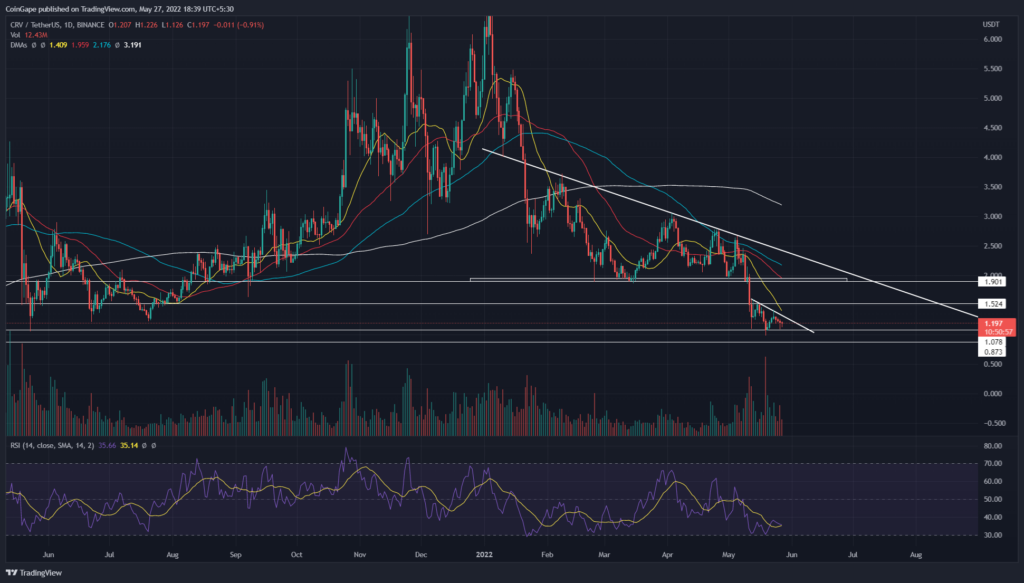
The falling CRV price paused $1 psychological support and witnessed a minor consolidation for the past couple of weeks. This wavering price forms a descending triangle pattern, threatening a longer correction for CRV, but the crucial support level delays a fallout.
Key points:
- The rising RSI slope indicates growth in bullish momentum.
- The CRV price needs to face to descending trendline to establish a legit bull run.
- The intraday trading volume in the CRV token is $149.1 Million, indicating a 1% gain.
Source- CRV/USD chart by Tradingview
During the 2022 first four months, the CRV price took a heavy beating from a downsloping trendline, leading to the formation of a descending triangle pattern. Thus, pressured by a bearish pattern, the altcoin lost the neckline support($2) on May 11th.
A decisive breakdown from the $2 psychology support sank the CRV price to a $1 mark. Interestingly, the chart forms the same bearish pattern on a short scale. Therefore, the price action gradually squeezes narrower with a sharp descending trendline and $1 stiff support.
Trending Stories
Under the pattern influence, the CRV price breached $1 support and dipped to the next significant support at $0.88.
Conversely, suppose the buyers could undermine the selling pressure with a bullish breakout from the triangle pattern. In that case, the CRV price could surge almost 100% higher to hit the aligned resistance of $2 and long-coming descending trendline.
Thus, a bullish breakout from longer resistance could trigger a genuine recovery.
Technical analysis
In contrast to the falling price, the daily RSI slope trending higher bolsters the bullish breakout theory from the triangle pattern.
During early May, a sudden drop in CRV price brought a stepper downturn for the crucial DMAs(20, 50, 100, and 200), accentuating the high selling momentum. These DMAs may assist sellers in maintaining their trend control.
- Resistance levels- $1.5, and $2
- Support levels- $1 and $0.88


