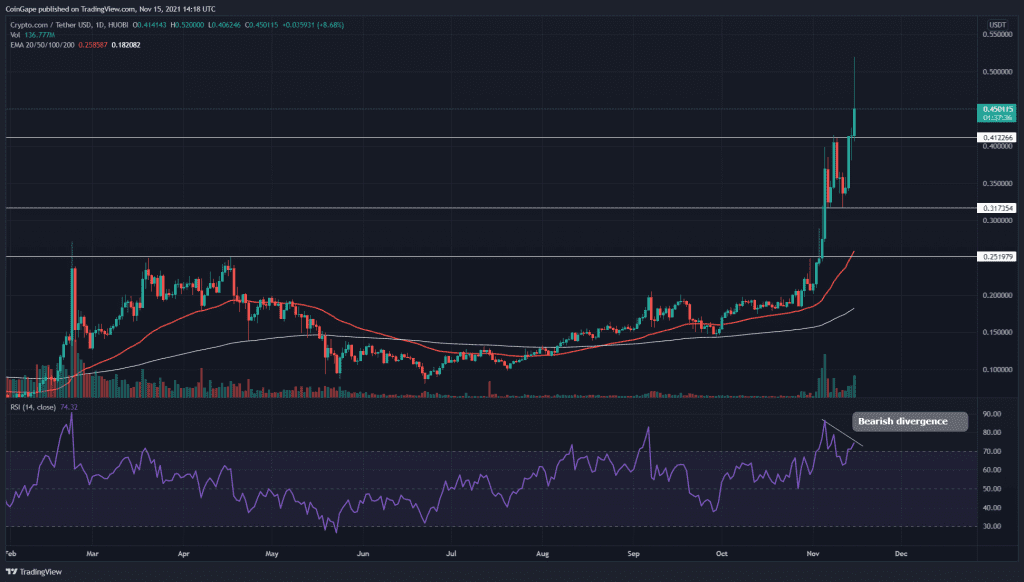
The CRO/USD token presents a strong uptrend in its technical chart. The token price managed to breach the previous All-Time High resistance of $0.421, indicating the coin has much more plans for November.
Key technical points:
- The daily RSI chart shows a significant divergence concerning the CRO token price
- The intraday trading volume in the CRO token is $970.3 Million, indicating a 120.1% hike
Source- CRO/USD chart by Tradingview
The CRO token initiated a significant up movement in its chart when the price gave an evident breakout from a crucial resistance of $0.251. The token price rallied around 60% before giving a proper retracement.
The retracement phase obtained sufficient support from the $0.317 mark, and the token decided to countries this rally. As for now, the price has managed to breach the previous swing high resistance of $0.4, indicating another entry opportunity for crypto traders.
The crucial EMAs(20, 50, 100, and 200) project a strong uptrend in this token. The chart displays a bullish alignment of these EMA lines, which could provide good support to the price in case of a pullback.
The Relative Strength Index(74), the current sentiment for the token is bullish. However, the RSI chart has displayed a strong divergence, indicating the decreasing strength among the market buyers.
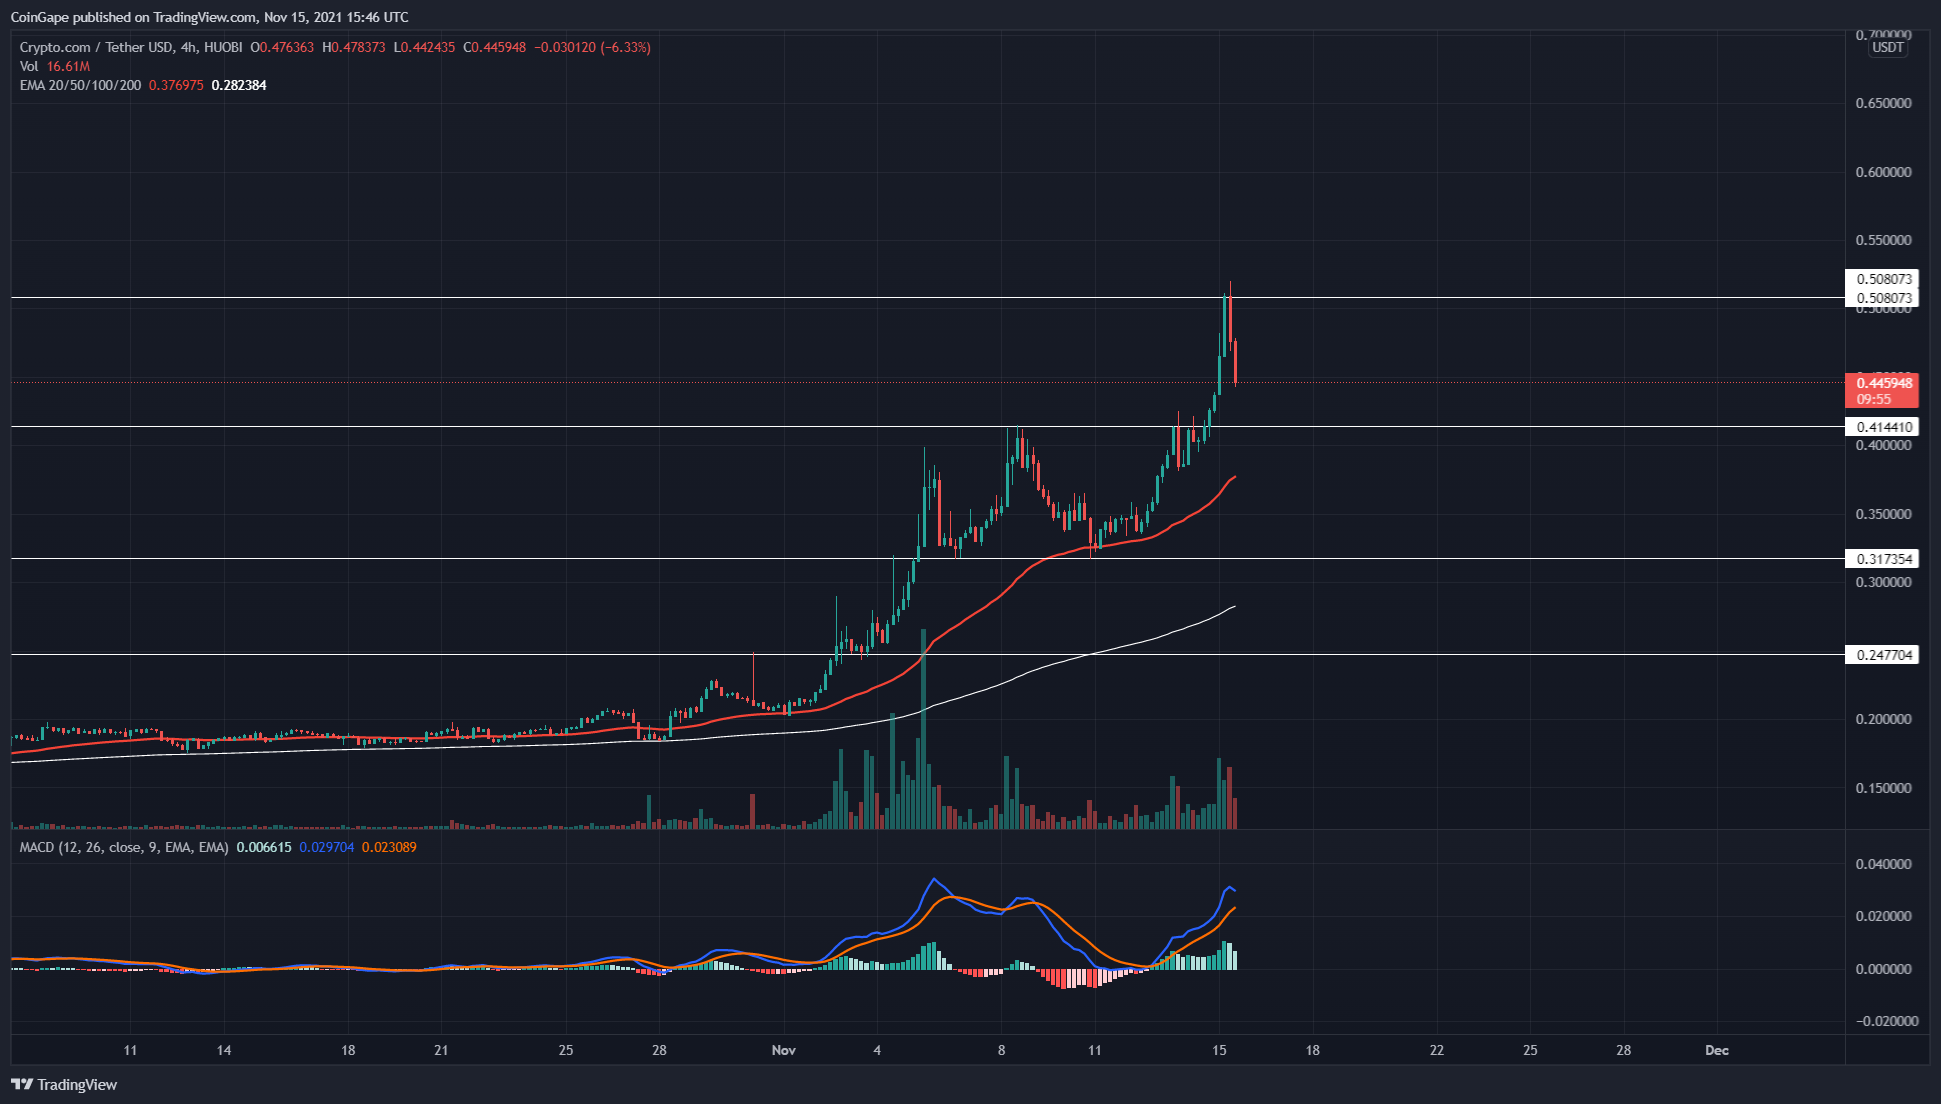
CRO/USD Chart In The 4-hour Time Frame

Source- CRO/USD chart by Tradingview
The CRO token price is currently retracing back to the breakout level to obtain sufficient support. However, as mentioned, the bearish divergence in the daily RSI chart indicates weakness in this rally. Therefore, the crypto traders should wait for proper confirmation before taking a new long position in this coin.
The MACD indicator projects a bullish momentum in this lower time frame chart, where both its lines are steadily climbing towards the higher levels.


