While the cryptocurrency market has a bearish outlook for cryptocurrency investors, some coins are still working to sustain their crucial support to start a new recovery. Let’s analyze the technical chart of these coins to learn what trading opportunities they can offer.
-
FTM Price Struggles To Surpass The $100-day EMA
Source-Tradingview
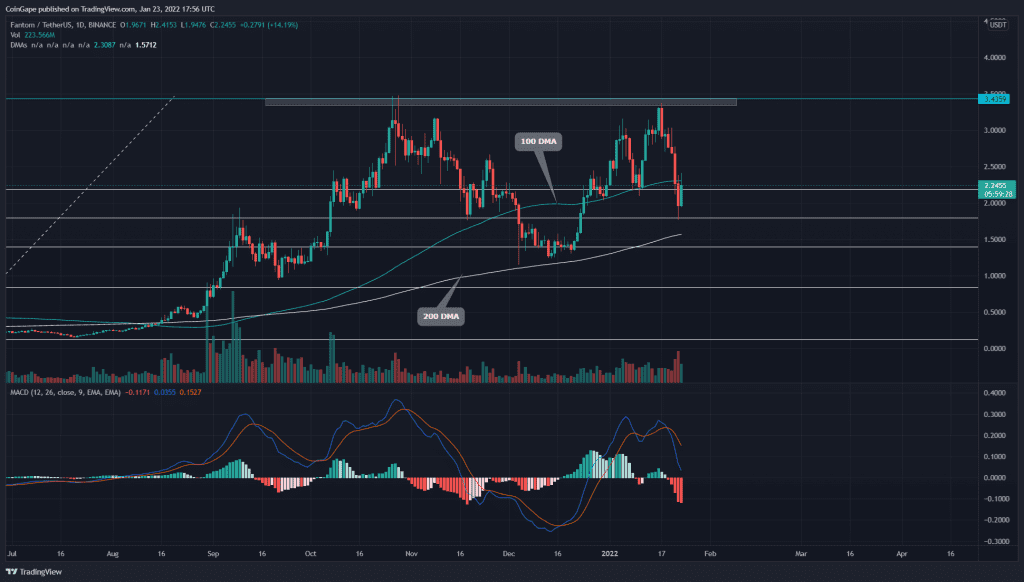
The FTM price shows an impressive V-shaped recovery during the first half of January. The coin price challenged the All-Time High resistance of $3.4; however, the intense sell-off in the cryptocurrency market rejected the price with a bearish engulfing candle.
The FTM price lost 45% in just one week and dropped to the $2.8 mark. Along with this support, the 0.5 FIB level provides strong demand to the coin price, triggering a 13% long green candle; however, the coin price is currently trying to cross above the $0.382 mark.
The FTM price faces strong resistance from the flipped resistance of $2.2, showing a long higher price rejection candles. If the coin sustains below this resistance the bear attack continues, and the FTM price could drop to the $1.8
The moving average convergence/divergence shows a bearish cross of the MACD and signal line descending to the midline.
-
LUNA Price Chart Shows Demand Pressure From The $63.3 Support

Source- Tradingview
Previously when we covered an article on Terra, Coingape mentioned the 100-day EMA line provides dynamic support to the LUNA price. On January 22nd, the coin showed a long lower price rejection hammer candle at this EMA line, indicating the presence of intense demand.
However, the LUNA price needs to show enough sustainability above 100 EMAs supports to trigger a bullish rally. On a contrary note, by violating the support line, the coin prices could plunge to the $50 mark.
The LUNA price trading above the 100 and 200 DMA maintains a bullish trend. However, the MACD indicator shows the signal and the MACD drops below the neutral zone(0.00).
Double Bottom Pattern Could Lead STX Price To $0.0050

Source- Tradingview
The STX price recovery rally in January resonated in an ascending broadening wedge pattern. This pattern pushed the coin to the All-Time High resistance of $0.386, where the coin faced immediate selling pressure to initiate a bearish reversal.
The STX price was discounted by 55% and plunged to the previous swing low support of $0.163. Furthermore, the coin shows a double top pattern in the daily time frame chart. If the price falls out from the bottom support, the coin could plunge to $0.21 support, followed by $0.0055.
The moving average convergence/divergence shows the MACD and signals entering the bearish territory, providing additional confirmation for a downtrend.


